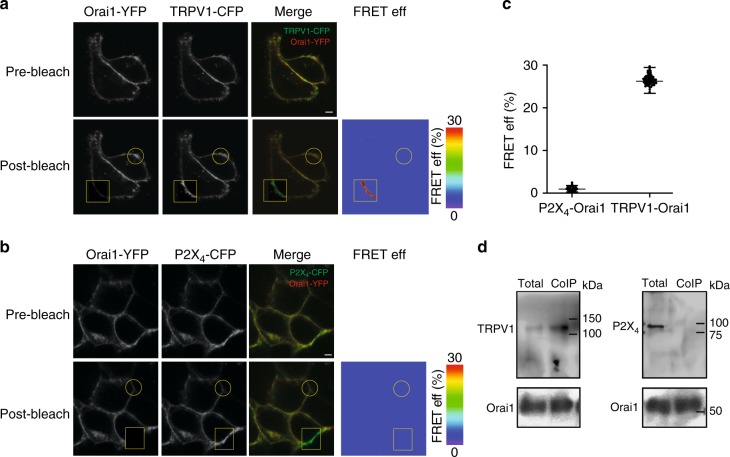
Fig. 4.
TRPV1 is in close proximity to Orai1. a Representative confocal images illustrating the expression of Orai1-YFP and TRPV1-CFP before (pre-bleach) or after (post-bleach) photobleaching of the acceptor (YFP). The square shows the area photobleached and the circle a control area not exposed to the photobleach procedure. We used both areas to calculate the FRET efficiency as indicated in Methods. Right panel shows the FRET efficiency (FRET eff) in pseudo color calculated from the acceptor photobleaching protocol (Methods). Scale bar 1 µM. b Representative confocal images illustrating the expression of Orai1-YFP and P2X4-CFP before (pre-bleach) or after (post-bleach) photobleaching of YFP. The square shows the area photobleached and the circle a control area not exposed to the photobleach procedure. FRET efficiency (FRET eff) in pseudo color calculated from the acceptor photobleaching protocol (Methods). Scale bar 1 µM. c FRET eff (%) obtained from at least 45 cells for P2X4-Orai1 and TRPV1-Orai1. Data show the mean ± standard deviation. d Co-immunoprecipitation analysis of cells expressing c-Myc-Orai1 and TRPV1-YFP or P2X4-CFP (for the entire blots check Supplementary Figures). Total indicates the protein that was not retained in the affinity column, thus reflects the protein that did not co-immunoprecipitate (Methods). Blots are representative examples from at least 3 independent blots

