Fig. 5.
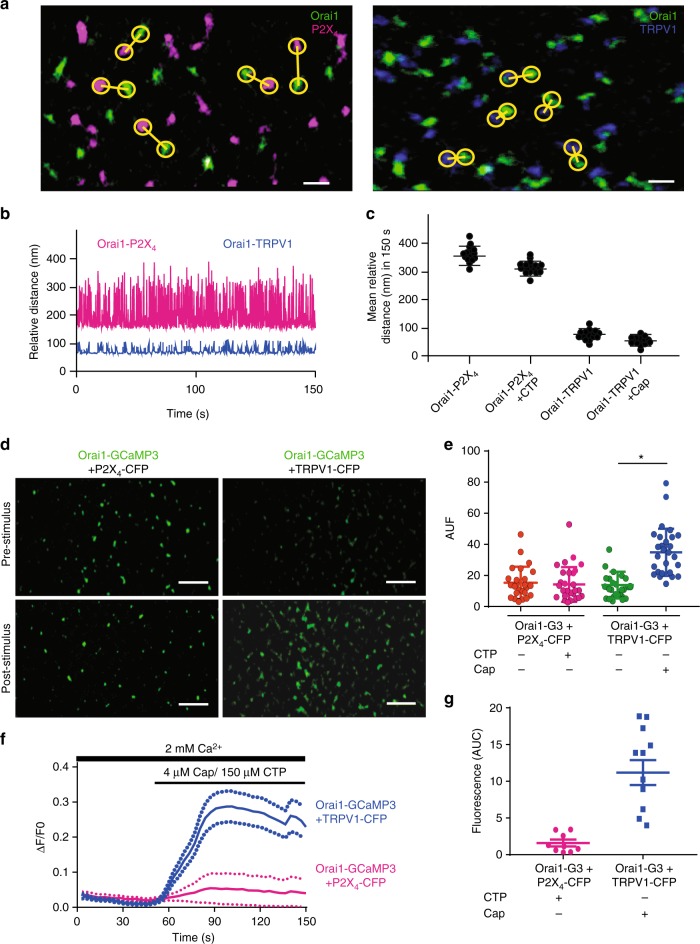
Super resolution studies reveal that TRPV1 and Orai1 move in close proximity in the plasma membrane. a Super resolution single channel TIRFM images from cells expressing Orai1 (green) and P2X4 (magenta) in the left panel or Orai1 (green) and TRPV1 (blue, right panel). Yellow circles show measurements between the nearest two channels for Orai1-P2X4 (left panel) or Orai1-TRPV1 (right panel). Scale bar 60 nm. b Relative distance over time for a single pair of channels measured in cells expressing Orai1-P2X4 (magenta) and Orai1-TRPV1 (blue). c Mean relative distance obtained from several hundred channels in cells expressing Orai1-P2X4 (magenta) with or without CTP and Orai1-TRPV1 (blue) with or without capsaicin. Notice that agonist stimulation (CTP or capsaicin) did not alter mean distances. d Super resolution single channel TIRFM images from cells expressing Orai1-GCaMP3 (green) + P2X4-CFP (left panels) or TRPV1-CFP (right panels) before and after stimulation with CTP or capsaicin. Notice the increment in the fluorescence of single Orai1-GCaMP3 channels after capsaicin stimulation but not with CTP. Scale bar 200 nm. e Fluorescence intensity in arbitrary units (AUF) reported by the Orai1-GCaMP3 sensor under the different stimulations. Notice that only cells expressing TRPV1 (T1-CFP) exposed to capsaicin produced an increment in fluorescence (blue bar). Capsaicin stimulation in cells without TRPV1 (orange and magenta bar) or cells expressing TRPV1-CFP but not exposed to capsaicin (green bar) did not result in changes in the fluorescence of Orai1-GCaMP3. f Fluorescence measurements of the entire field of view (containing dozens of individual channels) over time with cells expressing the Orai1-GCaMP3 sensor and TRPV1 with capsaicin (blue line) or cells expressing P2X4 and stimulated with CTP (magenta line). Lines show the mean ± standard deviations (dotted lines). Fluorescence from Orai1-GCaMP3 sensor increases only after capsaicin stimulation in cells expressing TRPV1. g Area under the curve (AUC) for the different conditions shown in panel f. Notice that only the fluorescence is observed in cells expressing the Orai1-GCaMP3 sensor + the TRPV1 channel and stimulated with capsaicin (green bar). *p < 0.01. The statistical significance was p < 0.05. Statistics was performed by Student’s t-test

