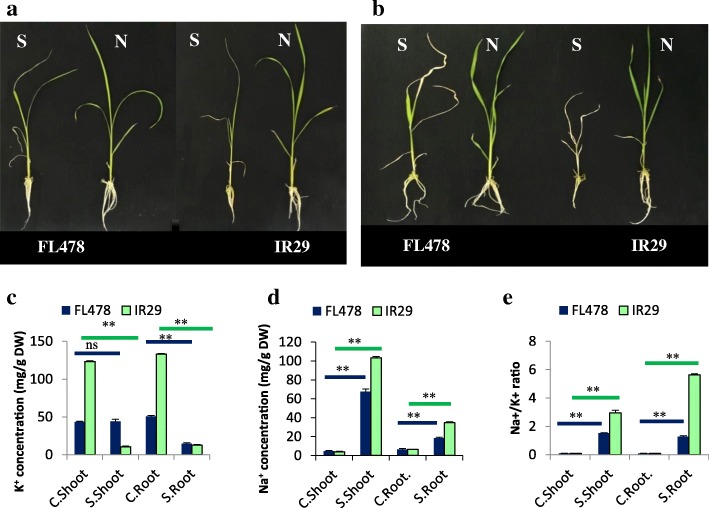
Fig. 1.
The 21-day-old seedlings of FL478 and IR29 at normal conditions and 24 h (a) or 1 week (b) after the onset of salinity stress (S:Salt, N:Normal); Concentrations of K+ (c) and Na+ (d), as well as Na+/K+ ratio (e) of shoots and roots in FL478 and IR29 seedlings grown under normal and salt stress conditions; Data are means ±SE. Asterisk (*) indicates significant differences between control and salt stress of the same genotype (**: P < 0.01, ns: not significant)

