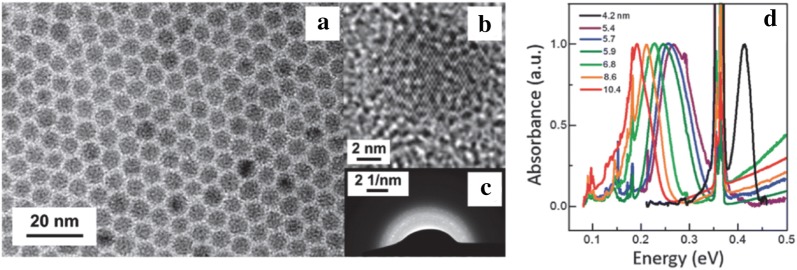
Fig. 13.
Synthesis and characterization of Ag2Se CQDs. a Low- and b high-resolution TEM images of the monodisperse Ag2Se CQDs and c corresponding electron diffraction. Image reproduced with permission from ref. [57]. Copyright 2011 American Chemical Society. d Ag2Se CQD FTIR data showing size tunable MWIR absorption throughout the whole MWIR window. The strong peak at 0.36 eV is attributed to the C–H stretches of the organic ligands
(Figure reproduced with permission from ref. [56]. Copyright 2012 Royal Chemical Society)

