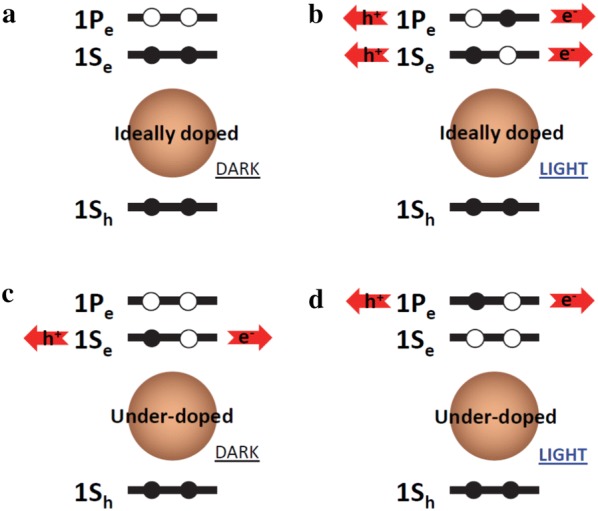
Fig. 14.

Carrier distribution and transport of intraband CQDs in ideally doped (a, b) and under-doped conditions (c, d). a, c Illustrate CQD under dark and b, d depict CQDs under illumination. 1Sh denotes the first valence energy level and 1Se and 1Pe denote the first and second conduction energy levels, respectively. Red arrows represent flow of charges under bias
