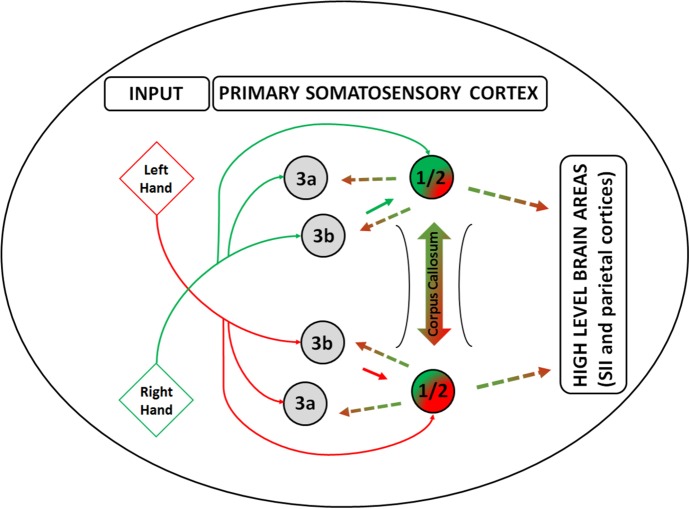
Figure 2.
Side integration model. A graphical model of tactile laterality information processing – i.e., Side Integration Model, highlighting the role of areas 1 and 2 in the primary somatosensory cortex in the integration of the lateralized tactile inputs from the two sides of the body. Red lines depict the primarily pathways of information flow coming from the left body side from tactile and proprioceptive afference, whereas green lines depict information coming from the right body side. Gradient line depicts the integration of the inputs from the two sides of the body through the corpus callosum, whereas the dashed lines depict the information flow including the body laterality towards the other areas within the primary somatosensory cortex and beyond. Inputs are depicted as diamond shapes and cortical brain areas as circles.

