
Figure 3.
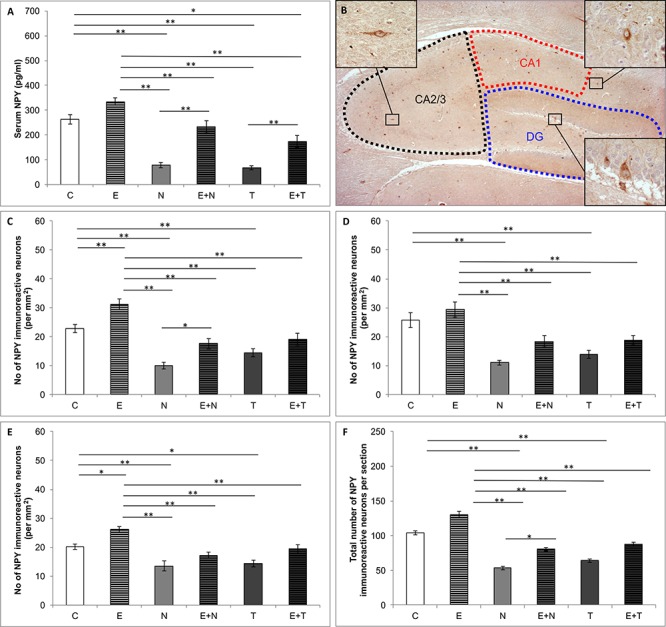
Quantification of NPY content. (A) Serum NPY levels; (B) Distribution of immunoreactive NPY neurons in hippocampus; (C–F) The number of NPY immunoreactive neurons in CA1 (C), CA2/3 (D), DG (E) and total hippocampal section (F); (C, control group; E, exercise group; N, nandrolone-decanoate group; E+N, exercise plus nandrolone-decanoate group; T, testosterone-enanthate group; E+T, exercise plus testosterone-enanthate group). Bars represent means ± SEM, ∗ denotes a significant difference p ≤ 0.025, ∗∗ denotes a significant difference p ≤ 0.01.