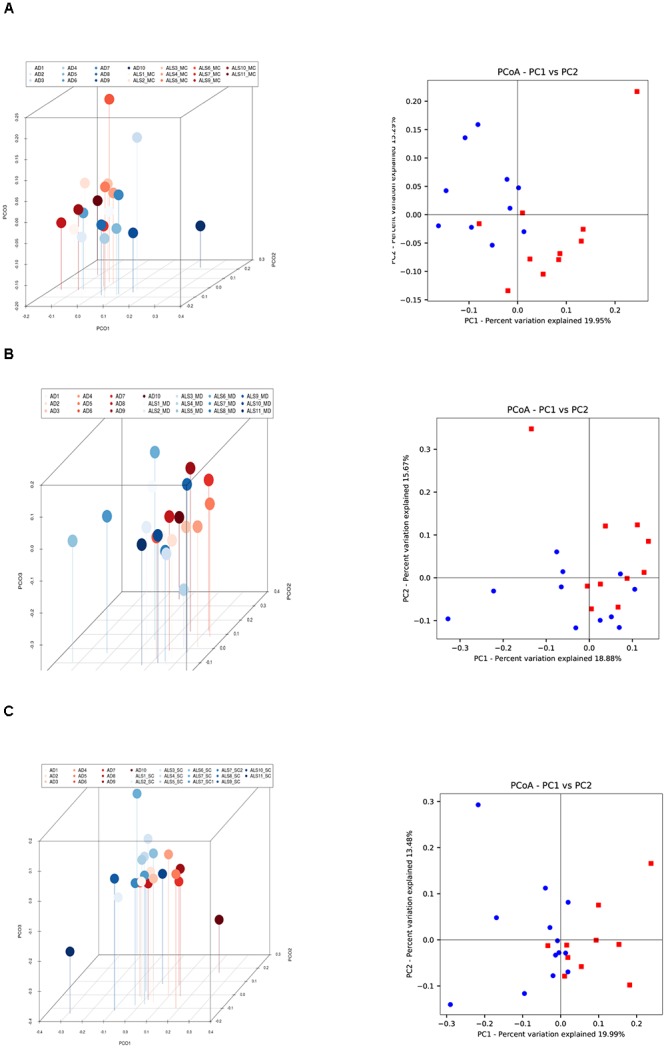
Figure 4.

Three- and two-dimensional principal component analysis of bacteria of CNS regions from ALS patients and AD patients. Comparison of three separate CNS regions between AD and ALS patients. (A) Left panel: three-dimensional (3D) principal component analysis (PCA) between MC regions of ten ALS patients (plots in red) and 10 AD patients (plots in blue). Right panel: 2D PCA. (B) Left panel: 3D PCA between MD regions of eleven ALS patients (plots in blue) and ten AD patients (plots in red). Right panel: 2D PCA. (C) Left panel: 3D PCA between SC regions of 11 ALS patients (plots in blue) and 10 AD patients (plots in red). Right panel: 2D PCA. The UniFrac method was used to calculate this parameter. MC, motor cortex; MD, medulla; SC, spinal cord.
