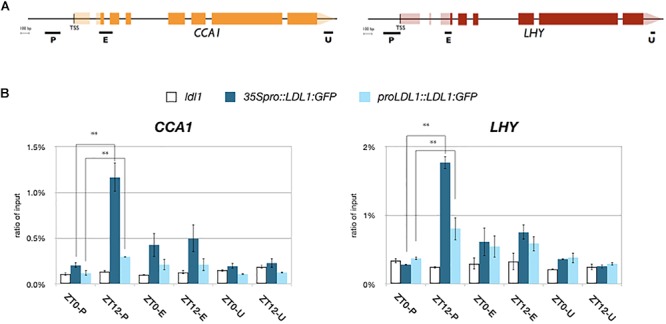
Figure 2.

LDL1/LDL2 target on CCA1 and LHY. (A) Schematic diagram of CCA1 and LHY. P: promoter region, E: coding region, U: 3′ UTR. (B) LDL1 bindis to the CCA1 and LHY promoters. 35S pro::LDL1:GFP or LDL1pro::LDL1:GFP was transformed into ldl1. 14 days-old seedlings grown under 12/12: light/dark were harvested on ZT0 or ZT12. ChIP assays were performed with the anti-GFP antibody. The amount of immunoprecipitated DNA was quantified by qRT-PCR. Values represent the average immunoprecipitation efficiencies (%) against the total input DNA. Error bars correspond to standard deviations from three biological replicates. ∗P < 0.05, ∗∗P < 0.005 (Student’s t-test).
