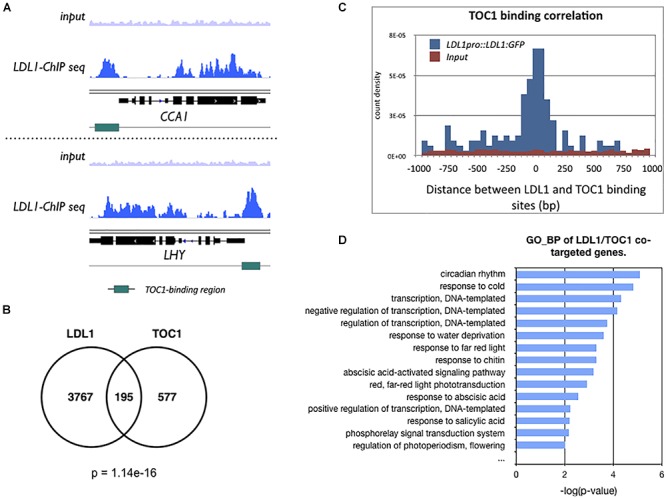
Figure 3.

LDL1-occupied sites in the genome identified by ChIP-seq analysis. (A) Integrated genome view of LDL1 binding peaks on CCA1 and LHY. green BARS indicate the TOC1-binding regions form previous published data (Huang et al., 2012). (B) Overlap between TOC1 target genes (Huang et al., 2012) and LDL1 targeted genes (Hung et al., 2018) (hypergeometric distribution of TOC1 and LDL1 co-targeted genes: p = 1.14e–16). (C) Distribution of distances between the total binding sites of LDL1 and TOC1. (D) GO-BP annotation of LDL1/TOC1 co-occupied genes. Annotation terms with p-value < 0.01 were listed.
