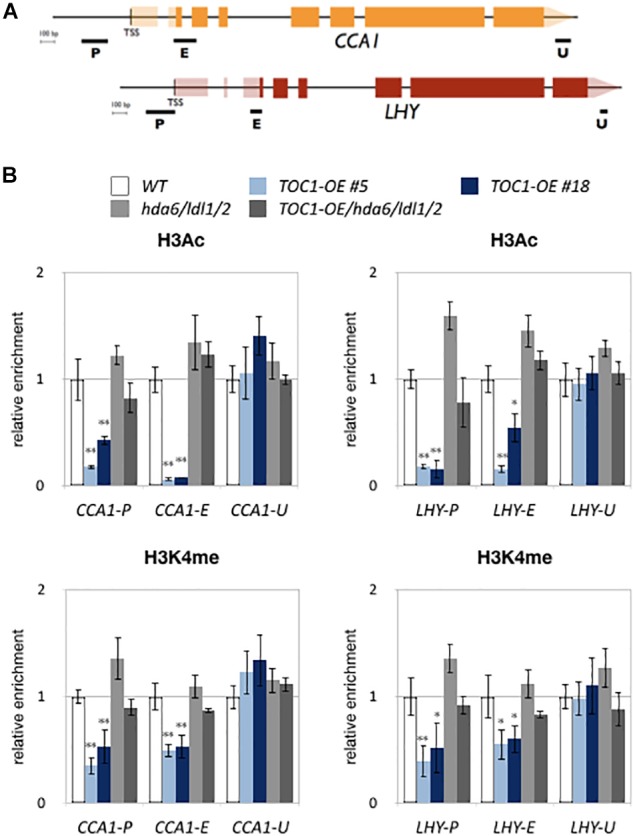
Figure 5.

LDL1/2-HDA6 is involved in regulation of H3Ac and H3K4me of CCA1/LHY. (A) Schematic diagram of CCA1 and LHY. P: promoter region, E: coding region, U: 3′ UTR. (B) ChIP analysis of H3ac and H3K4me levels of CCA1 and LHY in TOC1-OE plants on ZT0. The amounts of DNA after ChIP were quantified by qRT-PCR and normalized to ACT2. Plants were grown under 12/12 : light/dark for 14 days. Data points represent the average of three technical replicates. Error bars correspond to SD from three biological replicates. ∗P < 0.05, ∗∗P < 0.005 (Student’s t-test).
