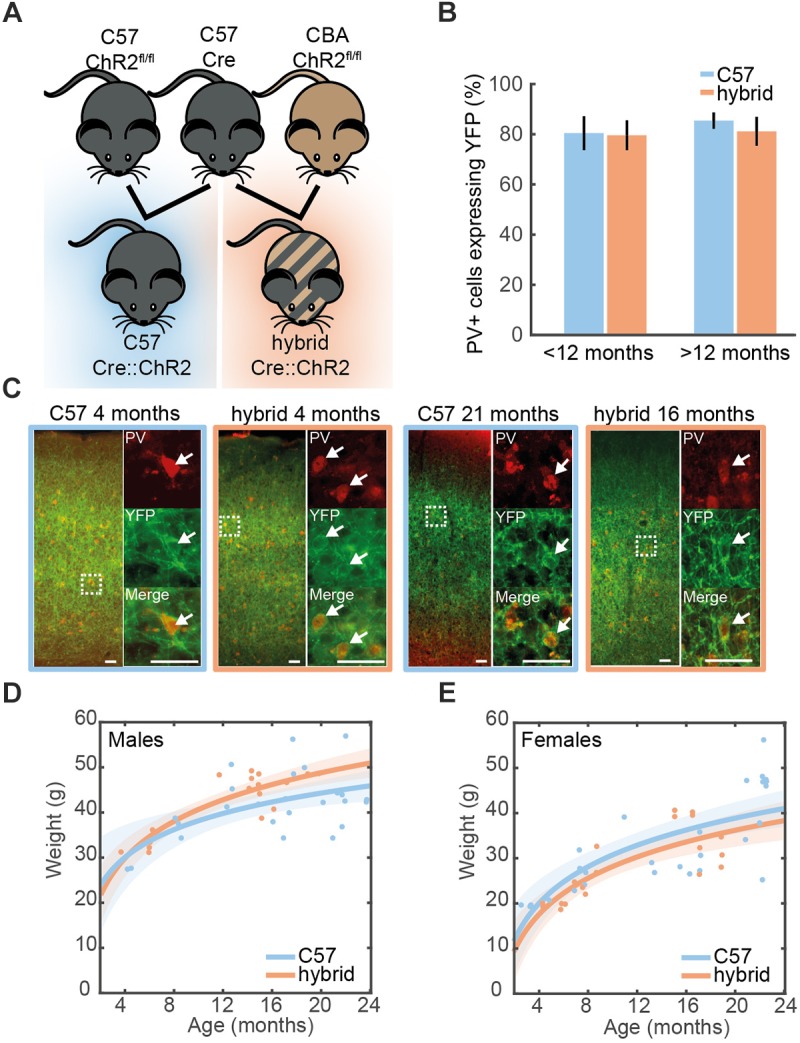
FIGURE 1.

Cell-type-specific expression of ChR2 in the auditory cortex. (A) A genetic strategy to compensate for the hearing deficit in C57 mice. A Cre-driver line on C57 background (top middle) was crossed with Ai32cba/ca mice, a floxed ChR2 mouse line on CBA/Ca background (top right), to create F1 hybrid mice (bottom right). (B) Proportion of cells expressing PV that co-expressed ChR2-YFP in the auditory cortex of young (<12 month old) and old (>12 month old) PV-Crec57::Ai32c57 (C57) (n = 10) and PV-Crec57::Ai32cba/ca (hybrid) (n = 10) mice [for strain, F(1,19) = 0.28, p = 0.61; for age, F(3,19) = 1.25, p = 0.35, two-way ANOVA]. Error bars represent SEM. (C) Examples of ChR2-YFP expression (green) stained with anti-PV (red) in the auditory cortex from C57 and hybrid from young (left) and old (right) animals. Enlarged images represent co-expression of PV and ChR2-YFP. Scale bar, 50 μm. (D,E) Weight at time of recording for male (D) [26 C57, 17 F1 hybrid; F(1,39) = 2.57, p = 0.11, one-way ANCOVA] and female mice (E) [28 C57, 20 F1 hybrid; F(1,44) = 0.1, p = 0.75, one-way ANOVA]. Line is an exponential fit ( ). Shaded area represents the 95% confidence interval.
