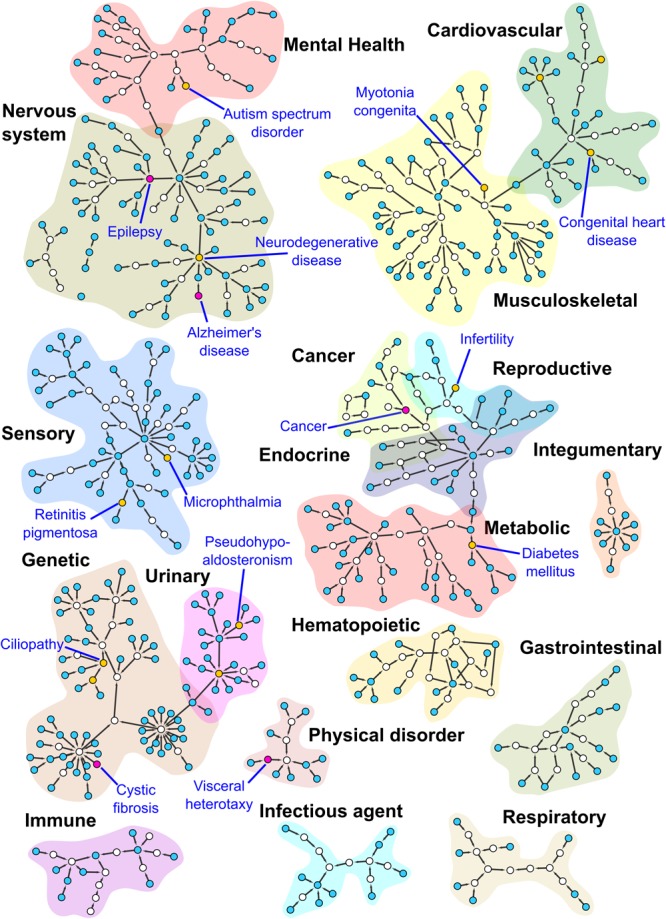
FIGURE 4.

Subnetworks from the DO. This figure shows MCL clustered subnetworks from a subset of the DO, consisting of terms annotated during our curation of the Xenbase human disease corpus detailed in the Supplementary Material. Nodes in the network are colored according to the number of direct annotations to the term they represent. Empty nodes have no direct annotations, blue nodes 1–5, yellow nodes 6–14 and purple nodes 15 and higher. Purple nodes and the yellow node(s) with the highest number of annotations for each cluster have been labeled. Cluster regions corresponding to high level DO terms have been highlighted for contrast and labeled. Some small subnetworks and singleton nodes have been moved to proximity with the high level DO term to which they are associated.
