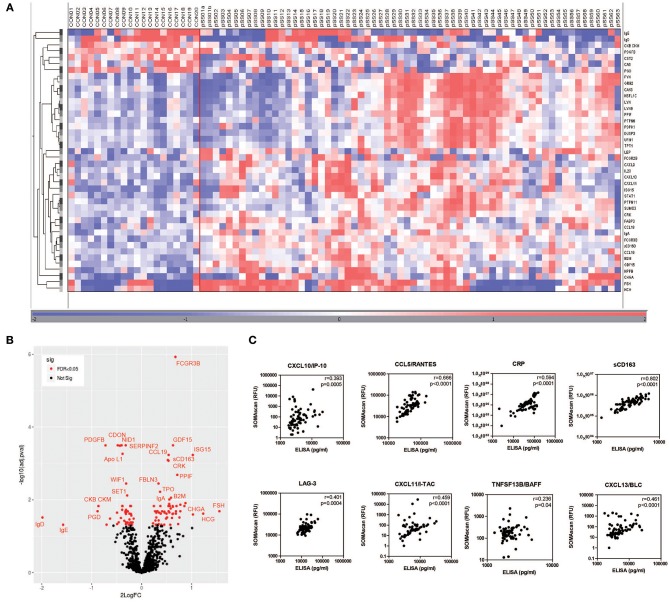
Figure 1.
Differential protein expression in serum of pSS and healthy controls. Heatmap of differentially expressed proteins measured by SOMAscan technology in serum samples of pSS patients (pSS) (n = 63) and healthy controls (CON) (n = 20) clustered unsupervised within the groups (A) and volcano plot (B) visualizing the same DEPs. The correlation between RFU determined by SOMAscan and protein levels determined by ELISA is shown in (C).

