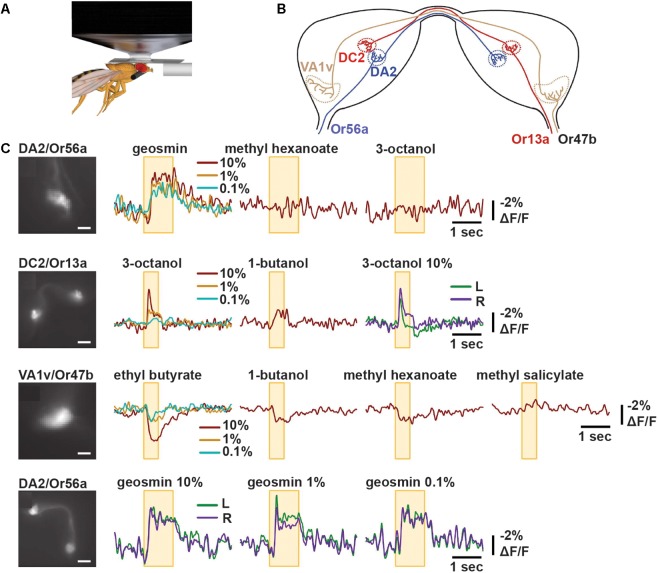
FIGURE 4.
ArcLight reports odorant responses in single trial recordings in Drosophila. (A) Schematic representation of in vivo imaging experiment of Drosophila antennal lobe following odorant presentation. (B) Schematic diagram of bilateral antennal lobes displaying projections of OSNs expressing Or56a, Or13a, or Or47b to their respective glomeruli. (C) Representative optical recordings of membrane activity at presynaptic terminals of OSNs following indicated odor application. The yellow box indicates the time of odor application. The colors indicate the different odorant concentrations 10, 1, or 0.1% or recordings obtained from the left (L) or right (R) glomeruli. Scale bars = 10 μm (panel 2 and 4) and 20 μm (panel 1 and 3) (Cao et al., 2013).

