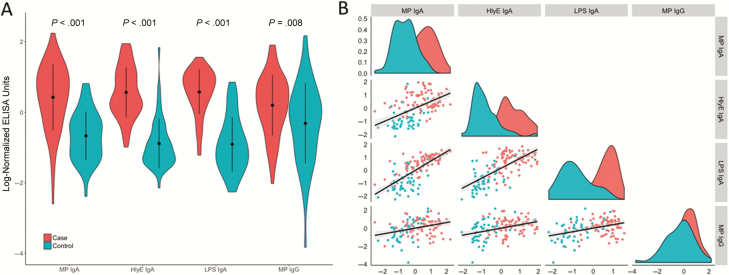
Figure 3.
Distribution of anti–Salmonella Typhi plasma responses in the Nepal cohort. A, Violin plots of immunoglobulin (Ig) A plasma responses against hemolysin E (HlyE), lipopolysaccharide (LPS), and membrane preparation (MP) and IgG plasma responses to MP in Nepalese study participants by cohort. Differences between groups were assessed using the Wilcoxon rank sum test. B, Density histograms for patients with culture-confirmed typhoid (red) and controls with other bacterial infections (teal) for each antigen, along with scatterplots and Pearson correlation of antibody responses between 2 selected antigens (column-row combinations). Abbreviation: ELISA, enzyme-linked immunosorbent assay.

