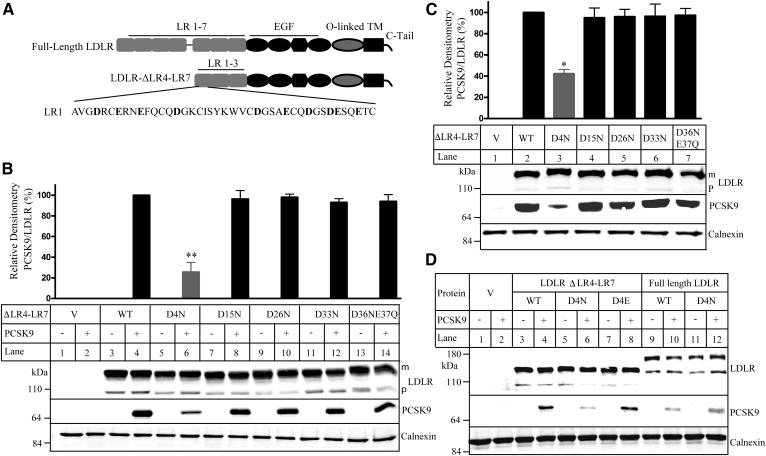
Fig. 1.
Binding of PCSK9 to the WT and mutated LDLR-ΔLR4-LR7. A: A schematic of the full-length LDLR and LDLR-ΔLR4-LR7 with an enlarged view of the LR1. Negatively charged amino acid residues in the LR1 are shown in bold. C-tail, C-terminal cytoplasmic tail; TM, transmembrane domain. B–D: Binding of PCSK9 to the WT and mutant LDLR-ΔLR4-LR7 at pH 7.4 (B) and pH 6.0 (C) or to the WT and mutant LDLR-ΔLR4-LR7 and full-length LDLR at pH 7.4 (D). HEK293 cells transiently expressing the WT or mutant LDLR-ΔLR4-LR7 or full-length LDLR were incubated with PCSK9 (2 μg/well) at pH 7.4 (B, D) or pH 6.0 (C). The same amount of whole-cell lysate was subjected to immunoblotting. The membrane was cut into halves. The top part was blotted with a monoclonal anti-LDLR Ab and a polyclonal anti-calnexin Ab. The bottom part was blotted with a monoclonal anti-PCSK9 Ab 15A6. The bar charts in B and C were a percentage of the relative densitometry PCSK9 binding signal. It was the percentage of relative densitometry of PCSK9 binding to mutant LDLR to that of PCSK9 binding to the WT LDLR that was defined as 100%. The relative densitometry of PCSK9 binding to LDLR was the ratio of the densitometry of PCSK9 to that of the mature form of LDLR. Values were mean ± SD of three or more experiments. The bottom images were representative ones of protein levels. The top bands of LDLR were the mature and fully glycosylated forms (m). The bottom bands of LDLR were the precursor forms (p). V: Cells were transfected with the empty vector, pCDNA3.1. Similar results were obtained from at least three experiments. * P < 0.05; ** P < 0.01.

