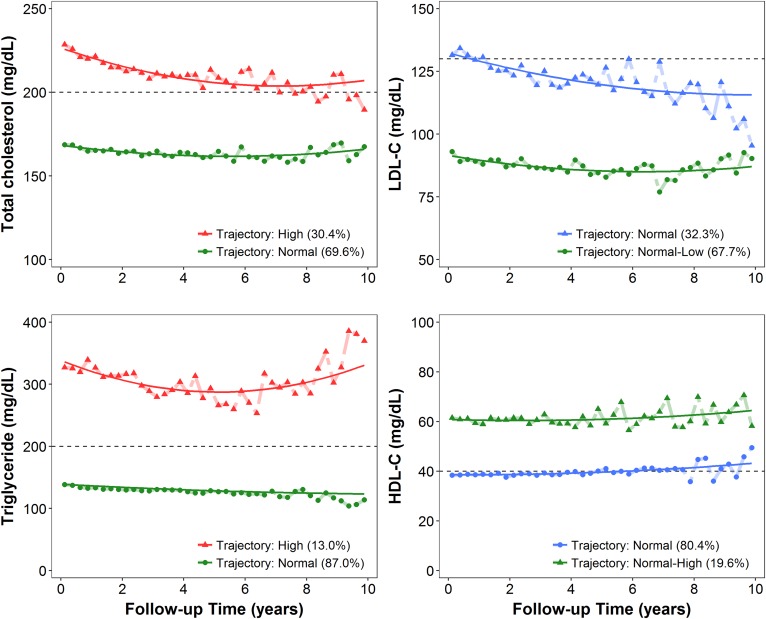
Fig. 1.
Serum lipid trajectories as defined through GBTM by using serial quarterly average levels of each lipid component, including T-CHO, TG, LDL-C, and HDL-C, over the course of CKD. The solid lines represent the averaged estimated trajectory, whereas the points represent the averaged observed trajectories. Green represents the reference group in the association analyses, red indicates that the level of lipid in the trajectory group is stably higher than the cutoff value (black dashed lines) according to the NCEP ATP III criteria, and blue indicates that the lipid level in the trajectory group was stably lower than or close to the NCEP ATP III cutoff value.

