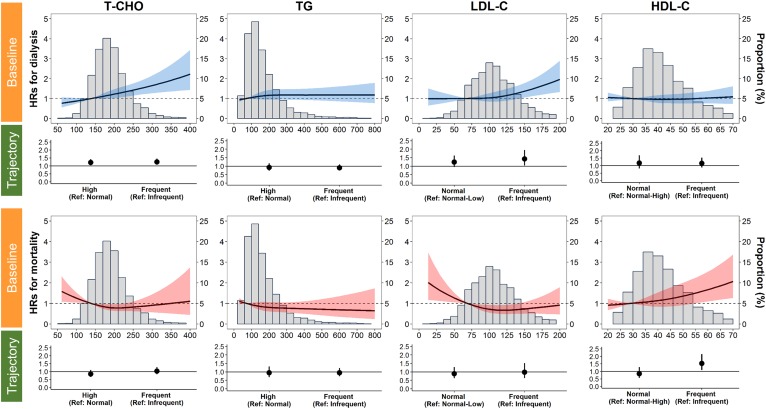
Fig. 2.
Adjusted HRs for ESRD requiring dialysis and all-cause mortality according to the baseline serum level of each lipid component. Solid lines represent adjusted HRs based on restricted cubic splines for baseline lipids. The shaded areas represent upper and lower 95% CIs. Reference was set at the tenth percentile of baseline lipid levels. Fully adjusted HRs (Tables 2 and 3, Model 5) comparing dyslipidemia-prone trajectory to reference trajectory of each lipid component are also plotted. Upper panels: Risk of ESRD requiring dialysis (blue). Lower panels: All-cause mortality (red). Variables adjusted are the same as those shown in Model 5 in Tables 2 and 3.

