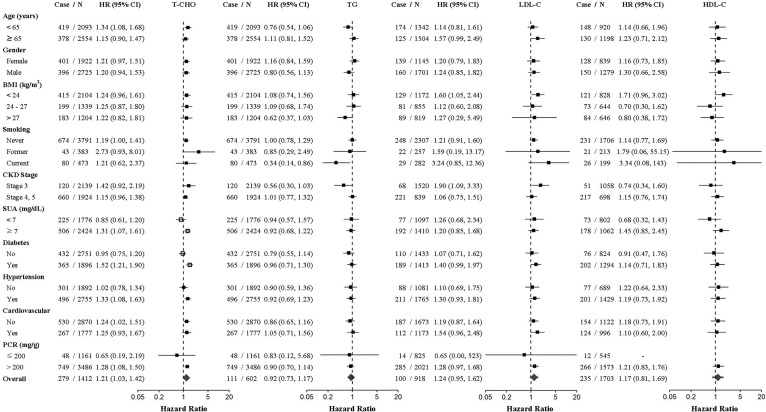
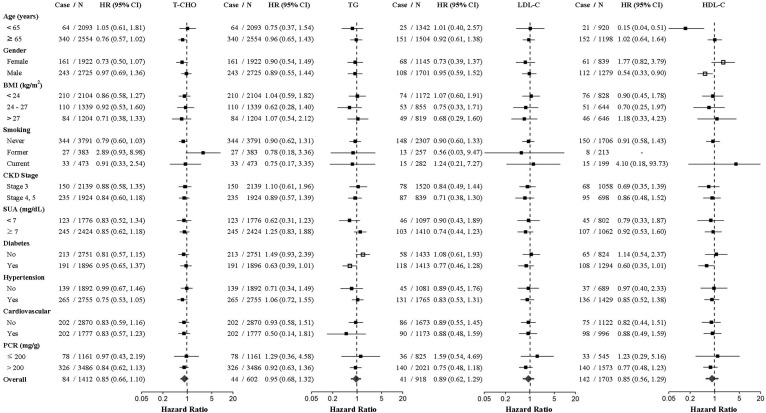
Fig. 3.
A: HRs for the risk of CKD progression to dialysis comparing the dyslipidemia-prone versus reference lipid trajectories for each lipid component (T-CHO, TG, LDL-C, and HDL-C). HRs were adjusted for the variables in Model 5 in Table 2, except for the stratifying variables. Estimated two-sided P < 0.05 for the interaction between lipid trajectories and participants’ characteristics are indicated by unfilled squares. B: HRs for the risk of all-cause mortality comparing the dyslipidemia-prone versus reference lipid trajectories for each lipid component (T-CHO, TG, LDL-C, and HDL-C). HRs were adjusted for the variables in Model 5 in Table 3, except for stratifying variables. Estimated two-sided P < 0.05 for the interaction between lipid trajectories and participants’ characteristics are indicated by unfilled squares.


