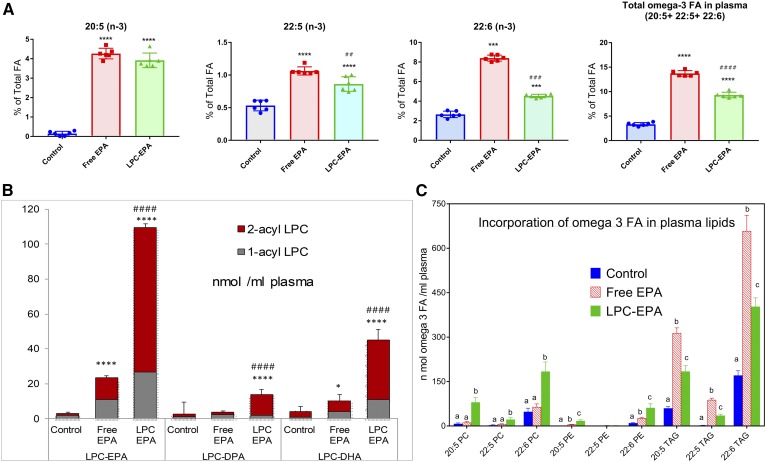
Fig. 1.
Effect of oral free EPA and LPC-EPA on plasma lipids. A: FA composition. The FA analysis was carried out by GC/MS, as described in the text. Only the omega 3 FAs are shown here. The total FA composition of plasma is shown in supplemental Table S1. The values shown are mean ± SD, n = 6 for each group. Statistical significance was determined by one-way ANOVA with post hoc Tukey multiple comparison test. *P < 0.05, **P < 0.01; ***P < 0.001; ****P < 0.0001 compared with control (ANOVA). #P < 0.05; ##P < 0.01; ###P < 0.001; ####P < 0.0001, LPC-EPA compared with free EPA (ANOVA). B: LPC species in plasma (nanomoles per milliliter). The composition of LPC species containing omega 3 FA was analyzed by LC/MS/MS in the MRM mode, as described in the text. The values shown are mean ± SD, n = 6 per group. Statistical significance was determined by one-way ANOVA with post hoc Tukey multiple comparison test. P value symbols are as in A. C: Incorporation of omega 3 FA in plasma lipids. Molecular species of PC, PE, and TAG containing 20:5, 22:5, and 22:6 were analyzed by LC/MS/MS in the MRM mode, as described in the text. The values shown are nanomoles of each omega 3 FA associated with the indicated plasma lipid, and are mean ± SD (n = 6 per group). The individual values were calculated by adding all the molecular species of each lipid containing the indicated omega 3 FA. The values were corrected for the number of molecules of omega 3 FA expected in each molecular species (for example: for 16:0-20:5 PC, the nanomoles of 20:5 are the same as the nanomoles of PC, whereas for 20:5-20:5 PC, the nanomoles of 20:5 are double the nanomoles of PC, and for 20:5-20:5-20:5 TAG, there are three times the nanomoles of TAG). Bars with different letters are significantly different from each other (one-way ANOVA).

