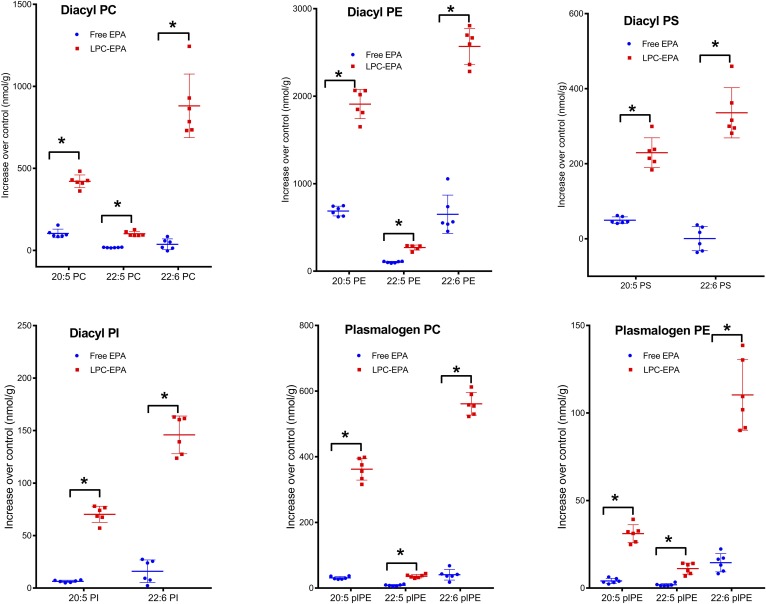
Fig. 3.
Increase in omega 3 FAs of brain phospholipids (nanomoles per gram). The molecular species of phospholipids containing the three omega 3 FAs were analyzed by LC/MS/MS, as described in the text. The increase in each species above the average of the control value was then calculated for the free EPA- and LPC-EPA-treated mice. The values shown are the sum of the increases in all molecular species containing the indicated FA (mean ± SD, n = 6 per group). *P < 0.0001, all differences between free EPA and LPC-EPA were significantly different by the unpaired t-test with Welch’s correction (GraphPad Prism). The increases in individual molecular species are shown in supplemental Figs. S1–S4.

