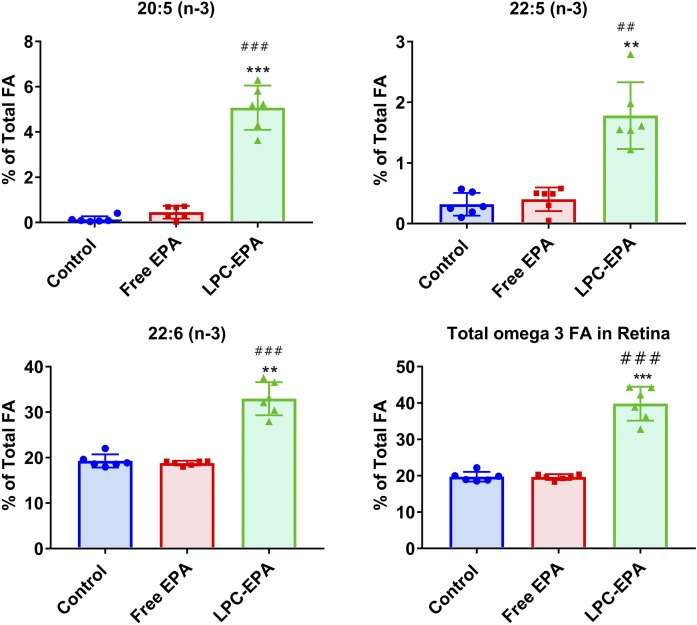
Fig. 6.
Effect of free EPA and LPC-EPA on the omega 3 FA composition of the retina. The total FA composition is shown in supplemental Table S7. Statistical significance was determined by one-way ANOVA with post hoc Tukey test. The symbols for the P values are the same as in Fig. 1.

