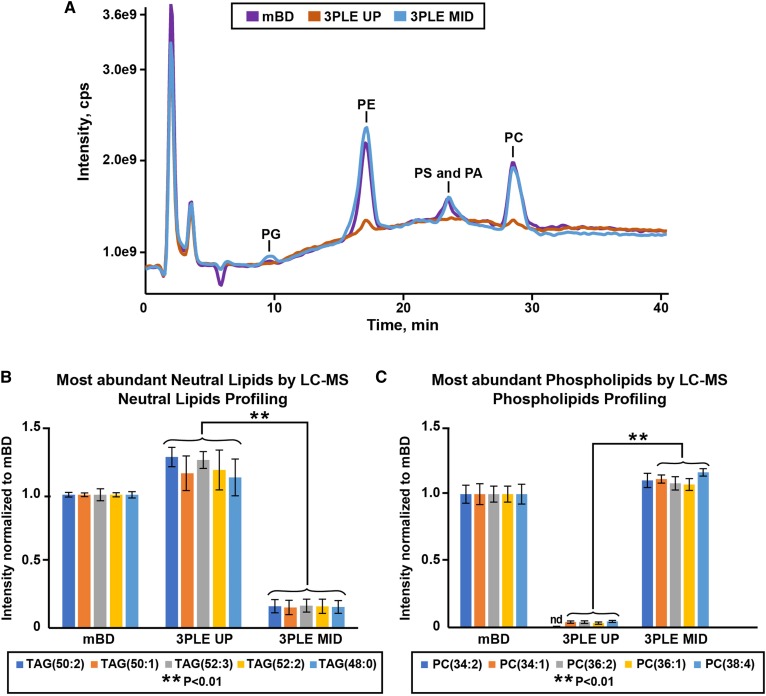
Fig. 3.
Bovine liver extracts analyzed by LC/MS. Data were obtained by the BD and 3PLE techniques. A: LC/MS analysis of phospholipids using the Q1 scan in the negative ionization mode. B: Most abundant neutral lipid species found in bovine liver BD, 3PLE UP, and 3PLE MID lipid extracts analyzed by LC/MS neutral lipid profiling in the positive ionization mode. Values are expressed as means and standard errors (n = 4; **P < 0.01). C: Most abundant polar lipid species found in bovine liver BD, 3PLE UP, and 3PLE MID lipid extracts analyzed by LC/MS phospholipid profiling in the negative ionization mode. Values are expressed as means and standard errors (n = 4; **P < 0.01). nd, not detected; PA, phosphatidic acid; PG, phosphatidylglycerol;PS, phosphatidylinositol.

