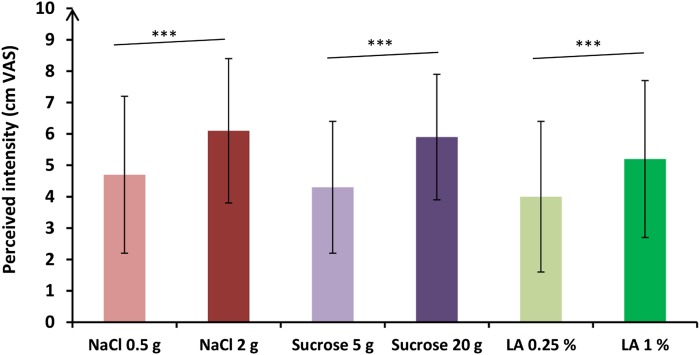
Fig. 4.
Mean (± SD) perceived intensities reported by the 18 participants for each of the taste solutions via VASs. VAS comparisons between the taste solutions obtained with post hoc analyses are expressed as follows. *** P < 0.001. The highest concentrated solutions were perceived more intense than the lowest ones, regardless of the taste of the solution.

