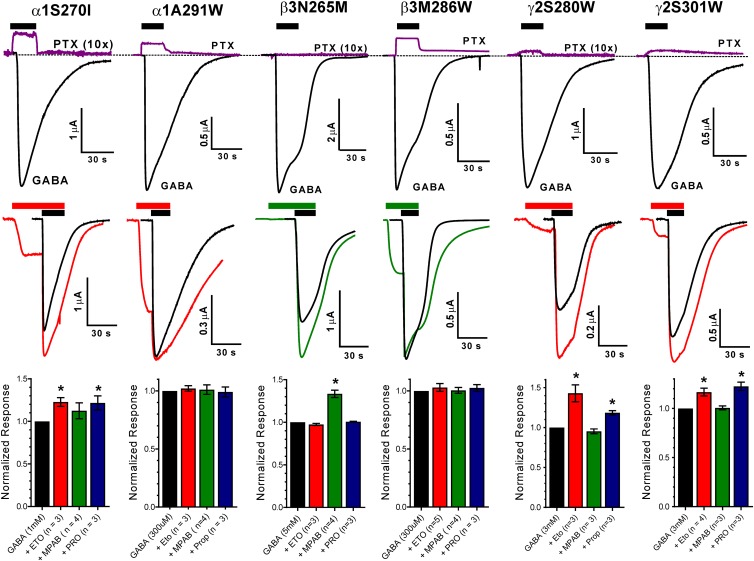
Fig. 2.
Spontaneous activation and maximal GABA efficacy of mutant GABAA receptors. (Top row) Each panel displays current sweeps recorded from a single oocyte expressing α1β3γ2L receptors containing a single point mutation (labeled above the traces). The purple lines show currents before, during, and after 2 mM PTX application, while the black lines show currents activated with maximal GABA (0.3–3 mM). Drug applications are indicated by black bars above traces. Outward currents during PTX application represent inhibition of spontaneously active receptors. The PTX traces for α1S270I, β3N265M, and γ2S280W have been amplified 10-fold to better illustrate the effects. Average IPTX/IGABA ratios are summarized in Table 1. (Middle row) Each panel displays current sweeps recorded from a single oocyte expressing α1β3γ2L receptors containing a single point mutation (labeled above the traces). The black sweeps show currents activated with maximal GABA. Colored traces are currents recorded during 15–30 second pre-exposure to either 3.2 µM etomidate (red lines) or 8 µM R-mTFD-MPAB (green lines) followed by these drugs combined with maximal GABA. Anesthetic applications are indicated by colored bars and GABA applications by black bars above the traces. Note that currents are elicited by anesthetic alone in all but one mutant receptor, and that in four mutant receptors anesthetic also enhances maximal GABA responses. (Bottom row) Bars represent normalized ratios (mean ± S.D.; n = 3) of peak currents in the presence vs. absence of anesthetics (etomidate = red; R-mTFD-MPAB = green; propofol = blue). Increased maximal GABA currents in the presence of anesthetic drugs indicates that GABA alone activates less than 100% of functional receptors (* indicates P < 0.05). Maximal GABA efficacy for each mutant receptor is the inverse of the maximum ratio induced by the three drugs (Table 1).

