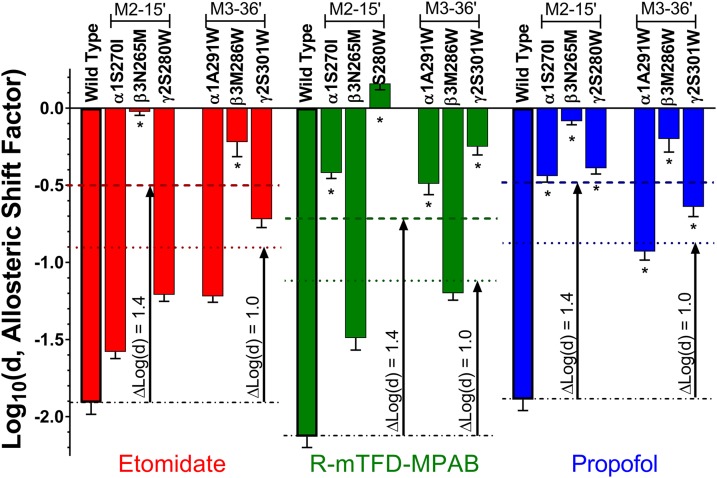
Fig. 5.
Summary of anesthetic allosteric shift parameters. Each bar represents a fitted log(d) value (mean ± S.D.) for one of the three equieffective anesthetic solutions in one of the seven types of GABAA receptors included in this study. Bars are color coded according to anesthetic (red = 3.2 µM etomidate; green = 8 µM R-mTFD-MPAB; blue = 5 µM propofol) and labeled with the corresponding receptor type. Mutants are grouped into M2-15′ and M3-36′ subgroups. Asterisks (*) indicate mutations at loci that are adjacent to the anesthetic’s binding sites, based on biochemical studies.

