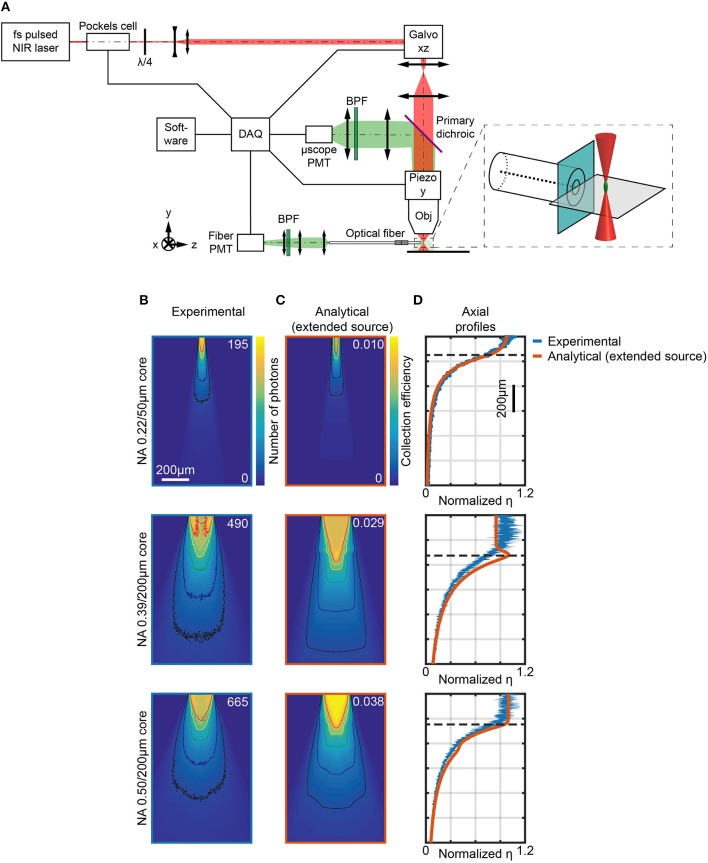
Figure 3.
Measurements of light collection efficiency using 2-photon generated fluorescent point sources. (A) Schematic representation of the two-photon microscope used to measure the collection field of optical fibers in quasi-transparent fluorescent medium. The inset shows a magnification of the fiber facet surroundings. (B) Section y = 0 of the collection field of 0.22/50 μm, 0.39/200 μm, and 0.50/200 μm optical fibers, as indicated, in a 30 μM PBS:fluorescein solution, obtained through the fiber PMT as shown in (A). Isolines at 10%, 20%, 40%, 60%, and 80% of the maximum number of photons are shown (in black, blue, green, yellow, and red, respectively). (C) Analytical calculations of collection efficiency diagrams for the three fibers in (B) immersed in a transparent homogeneous medium (n = 1.335) assuming a gaussian source with lateral FWHM rx, z = 3 μm, axial FWHM ry = 32 μm. Isolines at 10%, 20%, 40%, 60%, and 80% of the maximum number of photons are shown (in black, blue, green, yellow, and red, respectively). (D) Comparison of normalized experimentally-measured (blue curve) and analytically-calculated (orange curve) axial collection efficiency profiles (x = 0, y = 0) for the same fibers in (B). Normalization is done with respect to the average of the data points within the firsts 80 μm. The horizontal dashed lines represent z0. The width of the blue curves for the 0.39 NA/200 μm and 0.50 NA/200 μm fibers represents mean ∓ standard deviation over four different fibers.

