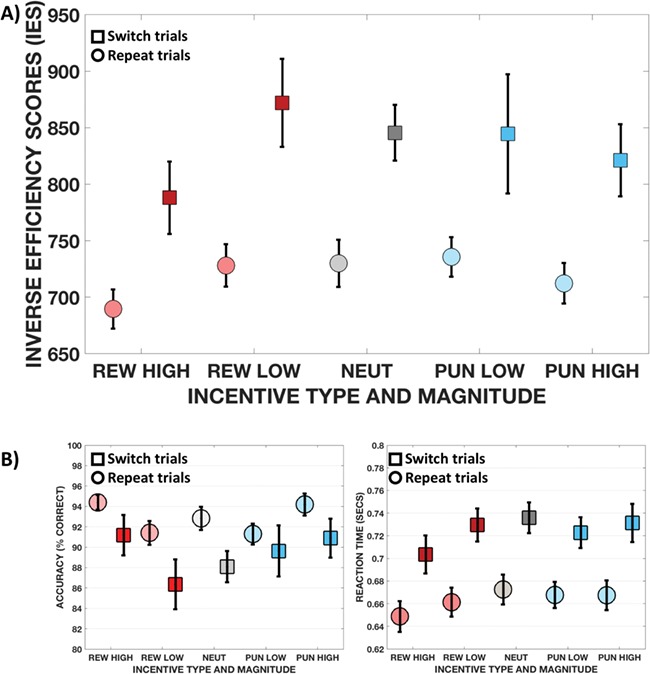
Fig. 2.

Bar charts showing performance. The upper panel shows the performance in the main outcome variable of the task, the IES for repeat and switch trials in the different incentive conditions. The lower panels show the performance in the two component measures of the IES: accuracy and RT. Circles depict repeat trials, squares indicate switch trials.
