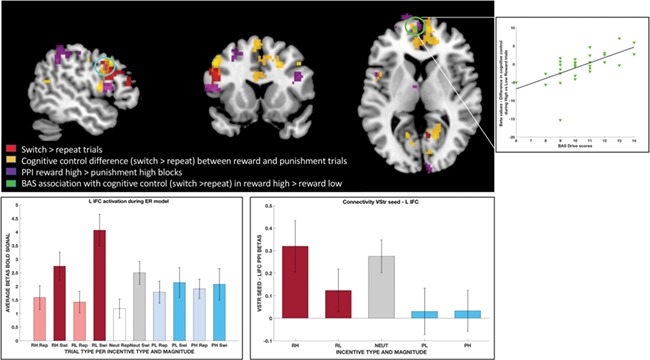
Fig. 3.

Overlap of results in the different analysis. Results from the different contrasts are shown in separate colors: (i) red voxels show increased activation for switch trials compared to repeat trials, (ii) yellow voxels show areas of increased activation during cognitive control under reward incentives relative to punishments, (iii) violet voxels show increased connectivity with the ventral striatum seed in the functional connectivity analyses and (iv) green voxels depict the increased activation during cognitive control in the context of increasing rewards that is associated with differences in reward sensitivity (BAS scores). The scatterplot on the upper right shows the beta coefficients for the contrast testing differences in cognitive control in the context of increasing rewards against differences in reward sensitivity (BAS scores). The bar graphs show beta coefficients in the left inferior prefrontal voxels circled in blue where contrasts (i), (ii) and (iii) overlap: (a) left: for each trial depending on the type, incentive valence and magnitude, in the GLM-1 model, allowing to see activation during the contrast of switch vs repeat trials and during the reward vs punishment trials during cognitive control; and (b) right: for each incentive block type, in the PPI connectivity analysis with the vStr.
