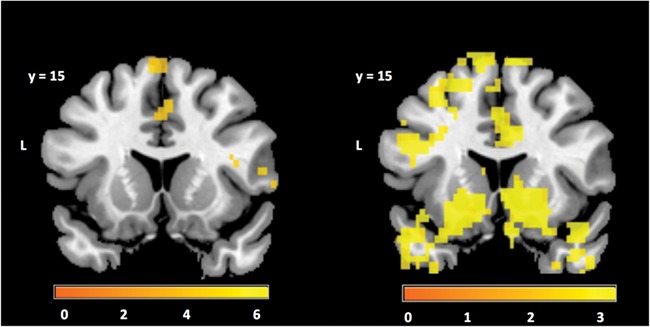
Fig. 4.

Regions showing incentive anticipation effects as revealed by the contrast for the first- and second-order parametric regressors (left and right, respectively) for incentive magnitude at the time when the upcoming block type was indicated (i.e. the fixation cross cue). The color bar scale indicates t-statistics derived from 5000 permutations of the data in voxels that are significant after correction for multiple comparisons (P < 0.05) at the whole brain level.
