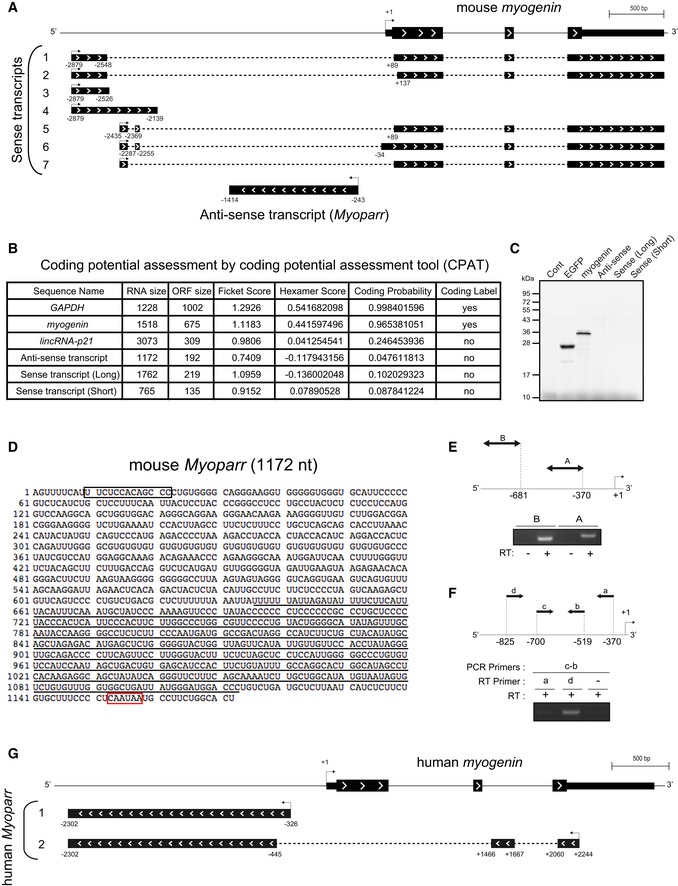
Schematic diagram of the results of 5′‐ and 3′‐RACE analysis of sense and anti‐sense transcripts. The 3′‐ends of several sense transcripts overlap with myogenin mRNA.
Coding potential assessment of the indicated RNAs using a coding potential assessment tool (CPAT). Low coding probabilities for anti‐sense transcript and sense transcript 1 (Long) and 4 (Short) as well as lincRNA‐p21 are shown.
In vitro transcription/translation of pCS2‐Anti‐Sense, pCS2‐Sense (Long), and pCS2‐Sense (Short). The pCS2+ vector was used as a negative control. pCS2‐EGFP and pCS2‐myogenin were used as positive controls.
The sequence of Myoparr cloned from mouse C2C12 cells. The potential RNA nuclear retention signal and putative polyadenylation signal are enclosed in a black and red box, respectively. The LINE‐1‐like sequence is underlined.
Schematic representation of the upstream region of human myogenin and regions amplified by RT–PCR (top). RT–PCR for novel transcripts in human primary myotubes (bottom). The presence or absence of reverse transcriptase (RT) is indicated by (+) or (−), respectively.
The primers used for RT–PCR (top). Strand‐specific RT–PCR for the novel transcripts in the upstream region of human myogenin (bottom).
Schematic diagram of the results of 5′‐ and 3′‐RACE analysis of human Myoparr.