-
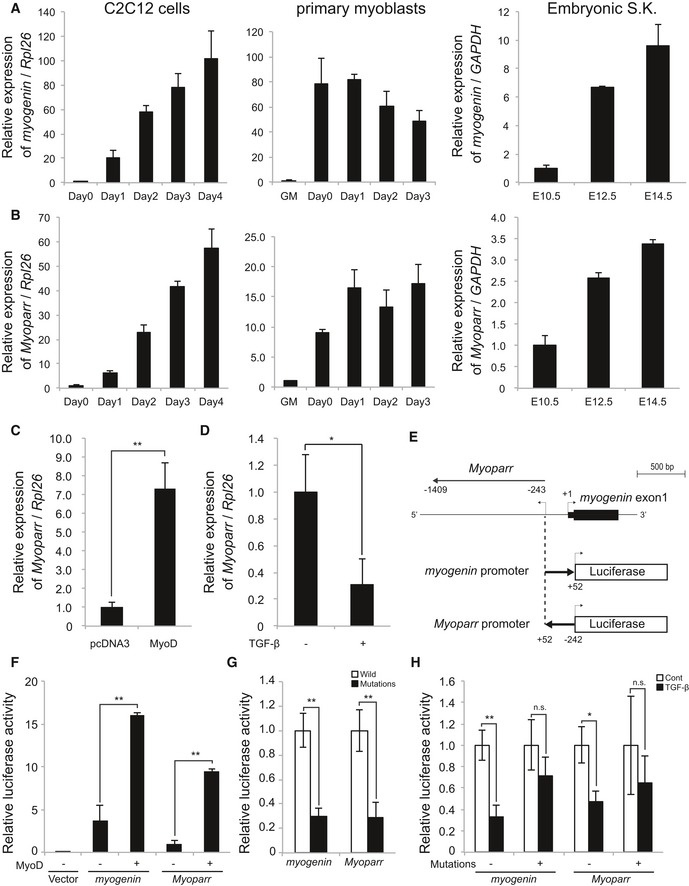
A, B
Quantitative RT–PCR for myogenin (A) and Myoparr (B) during myogenesis of C2C12 cells, primary mouse myoblasts (growth medium, GM), and mouse embryonic skeletal muscle (S.K.). The x‐axis shows days after differentiation induction or embryonic days. n = 3, mean ± SD.
-
C
qRT–PCR showing increased Myoparr expression by MyoD in C3H10T1/2 fibroblasts. n = 4, mean ± SD. **P < 0.01 (unpaired two‐tailed Welch's t‐test).
-
D
Treatment of recombinant TGF‐β for 24 h decreased Myoparr expression in differentiating C2C12 cells. n = 3, mean ± SD. *P < 0.05 (unpaired two‐tailed Student's t‐test).
-
E
Schematic diagram of the constructs used for luciferase assays.
-
F
Relative luciferase activities of the indicated promoter in differentiating C2C12 cells by exogenous MyoD. n = 3, mean ± SD. **P < 0.01 (unpaired two‐tailed Student's t‐test).
-
G
Relative luciferase activities of the indicated promoter with/without E‐box mutations in differentiating C2C12 cells. n = 3, mean ± SD. **P < 0.01 (unpaired two‐tailed Student's t‐test).
-
H
Relative luciferase activities of the indicated promoter with/without E‐box mutations in differentiating C2C12 cells by TGF‐β treatment. n = 3, mean ± SD. *P < 0.05. **P < 0.01. n.s., not significant (unpaired two‐tailed Student's t‐test).