
Figure EV2. Expression of mouse and human Myoparr .
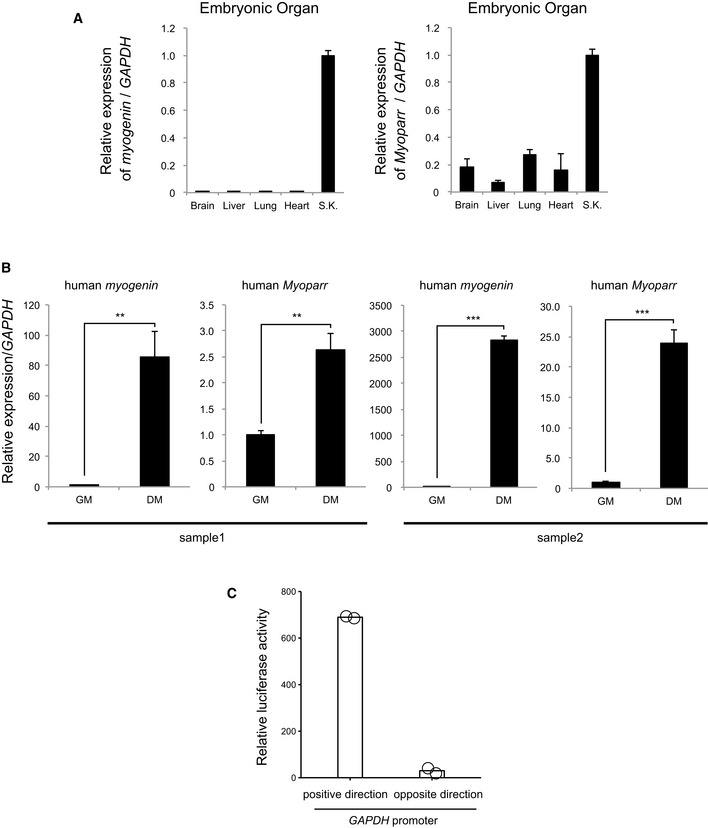
- Quantitative RT–PCR for mouse myogenin and Myoparr in embryonic organs. n = 3, mean ± SD. S.K., skeletal muscle.
- The expression levels of human myogenin and Myoparr in human primary myoblasts (growth medium, GM) and myotubes (differentiation medium, DM) evaluated by qRT–PCR. n = 4, mean ± SD. **P < 0.01. ***P < 0.001 (unpaired two‐tailed Welch's t‐test). Preparations from two independent specimens are shown.
- Relative luciferase activities of the GAPDH promoters (positive and opposite directions) in C2C12 cells. Bars indicate the average of two independent experiments, and open circles represent the values of each experiment.