-
A
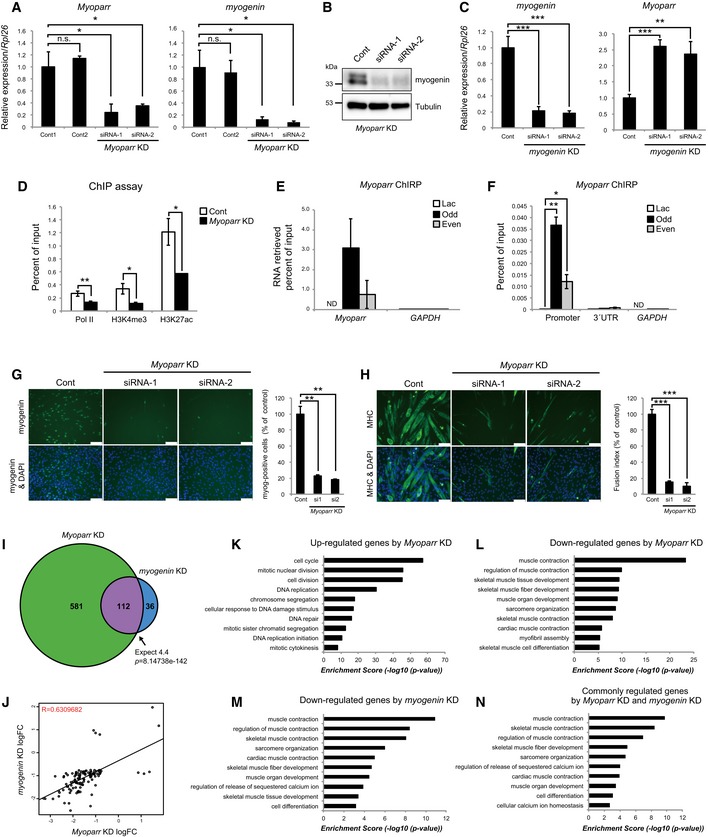
C2C12 cells were transfected with 50 nM of indicated siRNAs in growth medium. After additional 24‐h incubation in growth medium, cells were transferred to differentiation medium. The levels of Myoparr and myogenin expression were quantified by qRT–PCR 24 h after differentiation induction. n = 3, mean ± SD. *P < 0.05. n.s., not significant. Statistical analyses were performed using unpaired two‐tailed Student's t‐test (Myoparr; Cont1 vs. siRNA‐1, myogenin; Cont1 vs. Cont2). In cases of unequal variances (Myoparr; Cont1 vs. Cont2 and Cont1 vs. siRNA‐2, myogenin; Cont1 vs. siRNA‐1 and Cont1 vs. siRNA‐2), unpaired two‐tailed Welch's t‐test was used.
-
B
Western blot showing decreased expression of myogenin in differentiating C2C12 cells 48 h after Myoparr KD. Tubulin expression served as an internal control.
-
C
The expression levels of myogenin and Myoparr evaluated by qRT–PCR in myogenin‐depleted C2C12 cells. n = 3, mean ± SD. **P < 0.01. ***P < 0.001 (unpaired two‐tailed Student's t‐test).
-
D
ChIP‐qPCR detection of Pol II occupancy and histone modification status at the myogenin locus in Myoparr‐depleted differentiating C2C12 cells. The data were normalized to input values. n = 3, mean ± SD. *P < 0.05. **P < 0.01 (unpaired two‐tailed Student's t‐test or unpaired two‐tailed Welch's t‐test).
-
E
Retrieval rate of Myoparr using Myoparr‐ChIRP probes from C2C12 cells quantified by qPCR is shown as percent of input values. GAPDH was amplified as a negative control. n = 3, mean ± SD. ND, not detected.
-
F
ChIRP‐qPCR detection of the interaction between endogenous Myoparr and the myogenin promoter. The myogenin 3′UTR and GAPDH promoter were amplified as negative controls. The data were normalized to input values. n = 3, mean ± SD. *P < 0.05. **P < 0.01 (unpaired two‐tailed Welch's t‐test). ND, not detected.
-
G, H
Immunocytochemistry for the detection of myogenin at 24 h (G) or MHC at 72 h (H) in Myoparr‐depleted C2C12 cells after differentiation induction. Nuclei were counterstained with DAPI. Scale bars, 100 μm. The percentage of myogenin‐positive cells or fusion index is shown as percent of the control. n = 3, mean ± SD. **P < 0.01 (unpaired two‐tailed Welch's t‐test). ***P < 0.001 (unpaired two‐tailed Student's t‐test).
-
I
The intersection of genes regulated by Myoparr KD and myogenin KD shows a significant (Fisher's exact test) overlap 25.6 times as large as expected by chance alone.
-
J
Genes significantly differentially expressed in both Myoparr‐ and myogenin‐depleted cells show correlated expression (R = 0.63, log 2 ratio scale).
-
K–N
Enrichment of GO categories in genes up‐regulated by Myoparr KD (K), down‐regulated by Myoparr KD (L), down‐regulated by myogenin KD (M), and commonly regulated by both Myoparr KD and myogenin KD (N).