-
A
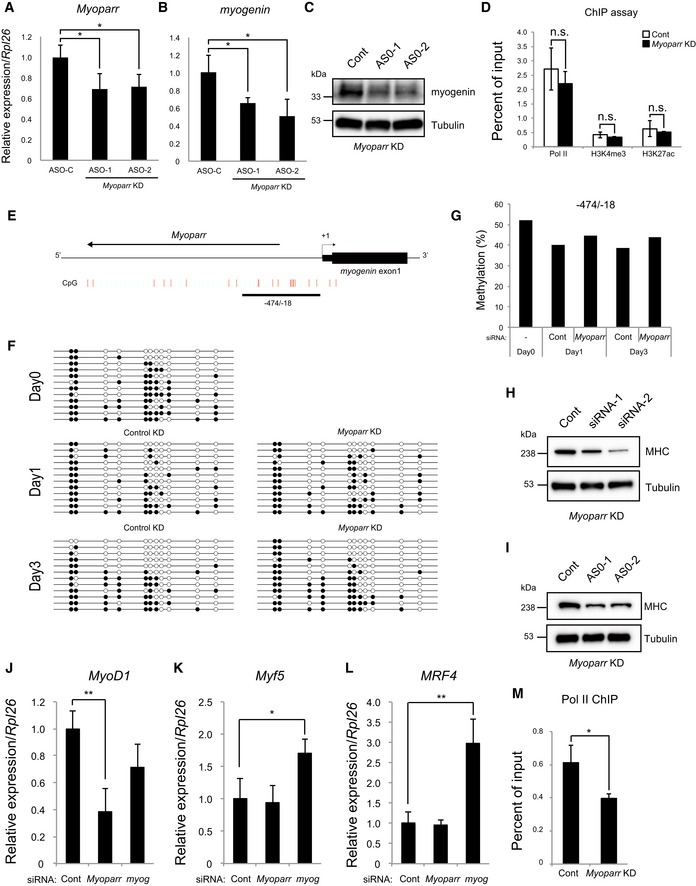
Quantitative RT–PCR for Myoparr expression in differentiating C2C12 cells transfected with control or Myoparr anti‐sense oligonucleotides (ASOs). Cells were transfected with 50 nM ASOs, and the levels of Myoparr expression were quantified by qRT–PCR 48 h after knockdowns. n = 3, mean ± SD. *P < 0.05 (unpaired two‐tailed Student's t‐test).
-
B
qRT–PCR showing decreased myogenin expression in differentiating C2C12 cells transfected with control or Myoparr ASOs. n = 4, mean ± SD. *P < 0.05 (unpaired two‐tailed Student's t‐test).
-
C
Decreased myogenin protein expression in differentiating C2C12 cells 48 h after Myoparr knockdown using ASOs. Expression of tubulin served as an internal control.
-
D
ChIP‐qPCR detection of Pol II occupancy and histone modification status at the GAPDH promoter in Myoparr‐depleted differentiating C2C12 cells. The data were normalized to input values. n = 3, mean ± SD. n.s., not significant. Statistical analyses were performed using an unpaired two‐tailed Student's t‐test (Pol II and H3K4me3). In cases of unequal variances (H3K27ac), an unpaired two‐tailed Welch's t‐test was used.
-
E
A schematic diagram of the CpG sites at the myogenin upstream region. Red lines indicate individual CpG sites. The methylation status at the −474/−18 region in Myoparr‐depleted C2C12 cells was examined.
-
F
The methylation status at the −474/−18 region is shown. C2C12 cells were transfected with 50 nM siRNAs. The methylation status was evaluated 1 and 3 days after differentiation induction. The day 0 sample is from non‐transfected cells. The CpG sites are indicated by circles (black and white circles indicate methylated and unmethylated cytosine sites, respectively), and each row represents an individual clone.
-
G
The methylation status of (F) is shown as a methylated/unmethylated ratio.
-
H, I
Decreased MHC expression by Myoparr knockdowns using siRNAs (H) or ASOs (I) in C2C12 myotubes. Expression of tubulin served as an internal control.
-
J–L
The expression changes of MyoD1 (J), Myf5 (K), and MRF4 (L) quantified by qRT–PCR either in Myoparr‐ or myogenin‐depleted differentiating C2C12 cells. n = 3, mean ± SD. *P < 0.05. **P < 0.01 (unpaired two‐tailed Student's t‐test).
-
M
Decreased Pol II occupancy at the MyoD1 promoter detected by ChIP‐qPCR in Myoparr‐depleted differentiating C2C12 cells. The data were normalized to input values. n = 3, mean ± SD. *P < 0.05 (unpaired two‐tailed Student's t‐test).