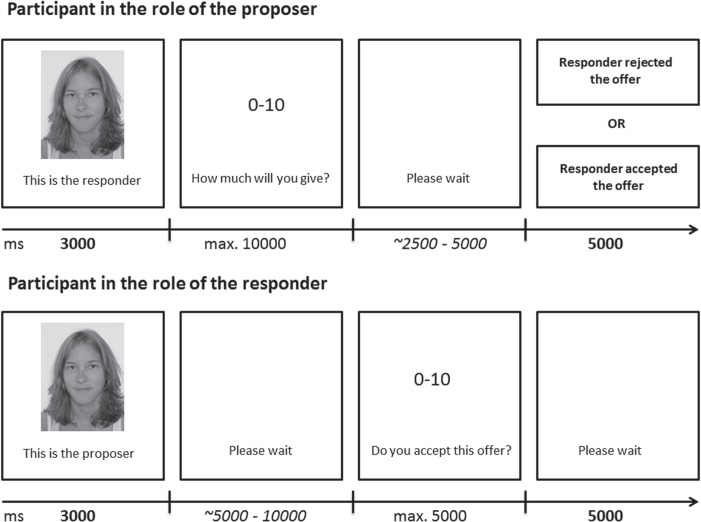
Fig. 1.
Depiction of the trial structure. Participants assumed the role of the proposer (upper) as well as in the role of responders (lower). Time scale is in milliseconds. Bold numbers represent fixed time windows. A tilde indicates a randomised time period and a ‘max’ indicates the maximum time participants had to react before the computer forced them to give the full amount of MU (proposer condition) or accept any amount from the other player (responder condition).

