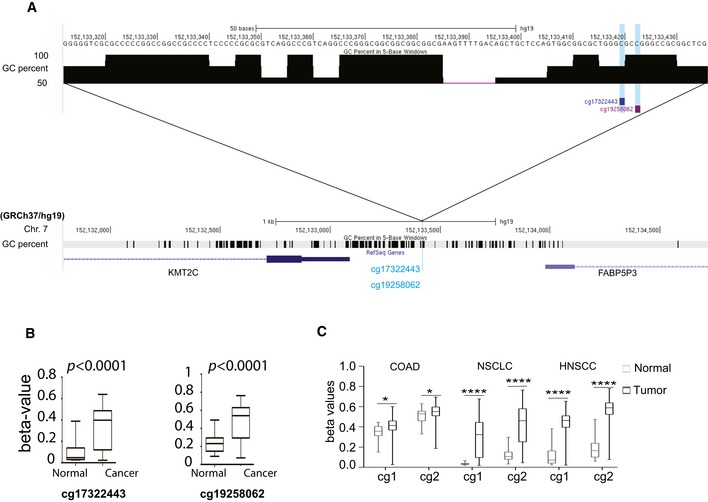
Figure EV1. KMT2C promoter methylation in human cancers.

- Schematic of the upstream promoter region of the KMT2C locus indicating the position and sequence of methylation detection probes within the CpG island (located at chr7:152435133–152437025, assembly GRCh38/hg38) that encompasses the KMT2C promoter region.
- Comparison of the methylation levels of the above probes in tumor samples and normal bladder tissue. Methylation data were obtained from TCGA through the MethHC database for n = 21 healthy/tumor pairs. Wilcoxon matched‐pairs signed‐rank test was used.
- Tumor vs. normal paired comparison of the methylation levels in the KMT2C promoter in various cancer types; cg1: cg17322443; cg2: cg19258062. Methylation data were obtained from the MethHC database (Huang et al 29). BC: n = 21, COAD: n = 21, NSCLC: n = 70, HNSCC: n = 50. For NSCLC analysis, separate cohorts from adenocarcinoma and squamous cell carcinoma were combined. Separate analysis of the two NSCLC subtypes yielded the same results. Wilcoxon matched‐pairs signed‐rank test was used. * designates P‐value < 0.05 and ****P‐value < 0.0001.
