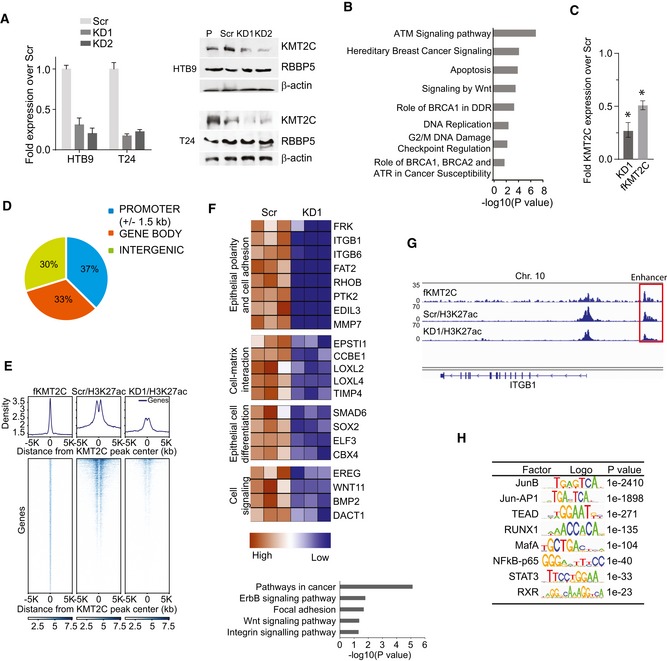
Figure 2. KMT2C loss leads to extensive epigenetic changes in human bladder cancer cells.

- KMT2C transcript (left) and protein (right) levels in human bladder cancer cell lines stably transduced with lentiviral vectors expressing shRNAs against KMT2C (KD1 and KD2) in comparison with Scr control cells expressing scrambled shRNAs (Scr). RBBP5, another COMPASS complex protein used as internal control and b‐actin as loading control. Transcript levels were assessed by qRT–PCR in triplicates, and values shown represent mean ± SEM.
- Bar graph showing selected biological processes and signaling pathways obtained from Gene Ontology (GO) enrichment analysis for the 3,324 differentially expressed genes between Scr control and KMT2C/KD1 HTB9 cells. Expression values were obtained from RNA‐seq data.
- Quantitative RT–PCR for KMT2C in HTB9/KD1 cells, and HTB9/KD1 cells stably transfected with a plasmid expressing a Flag‐tagged full‐length KMT2C protein (fKMT2C). Expression levels are shown in the y‐axis as respective ratios over KMT2C expression in Scr control cells (Scr expression corresponds to 1). Experiments were performed in triplicates and analyzed with Mann–Whitney U‐test. Values shown represent mean ± SEM. * designates P‐value < 0.05.
- Genome distribution of KMT2C peaks in HTB9/KD1 cells complemented with fKMT2C. Data obtained from ChIP‐seq experiments.
- Density plot indicating KMT2C binding and H3K27ac levels on active enhancers in Scr control and KD1 HTB9 cells.
- Bar graph showing selected biological processes and signaling pathways obtained from Gene Ontology (GO) enrichment analysis for 253 genes in proximity to active enhancers affected by KMT2C knockdown and heatmap of their expression (> 1.5‐fold H3K27ac and mRNA downregulation). Data obtained from ChIP‐seq and RNA‐seq experiments.
- Bedgraph indicating KMT2C binding and H3K27ac at a putative enhancer of the ITGB1 locus before and after KMT2C knockdown in HTB9 cells.
- Transcription factor binding motif analysis on active enhancers affected by KMT2C knockdown. Data obtained from ChIP‐seq experiments.
Source data are available online for this figure.
