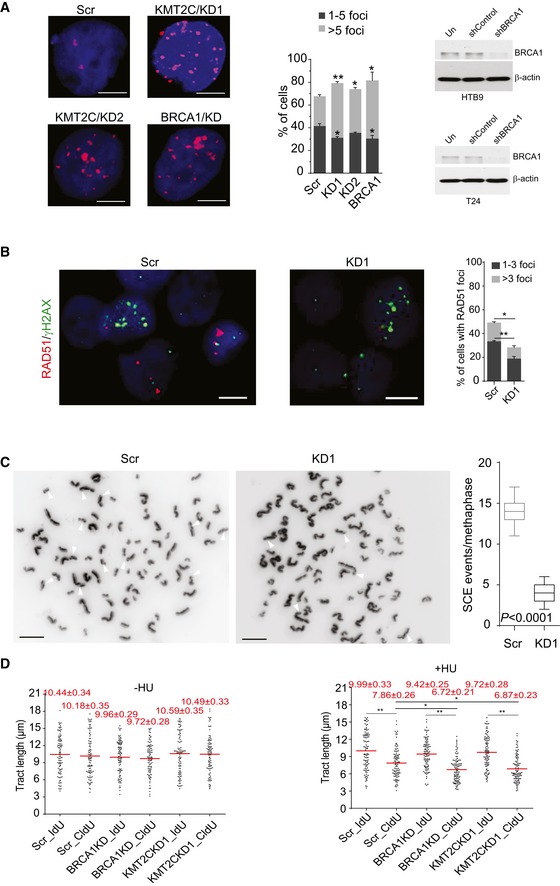
Figure EV2. Cells lacking KMT2C are HR‐deficient.

- Immunofluorescence of γH2AX foci and quantitation in control (Scr) and KMT2C‐knockdown (KMT2C/KD1 and KD2) T24 cells. BRCA1 knockdown (BRCA1/KD) is used as control. Scale bars indicate 10 μm. Values in the plot correspond to mean ± SEM. Data from three experiments were analyzed with Student's t‐test. * designates P‐value < 0.05, and ** designates P‐value < 0.01. Remaining protein levels of BRCA1 are also shown for both HTB9 (referring to Fig 5A) and T24 are also shown.
- Frequency of RAD51 foci in cisplatin‐treated T24 control (Scr) and KMT2C‐knockdown (KD1) cells. Scale bars indicate 10 μm. Values in the plot correspond to mean ± SEM. Data from three experiments were analyzed with Student's t‐test. * designates P‐value < 0.05, and ** designates P‐value < 0.01.
- Sister chromatid exchange assay with cisplatin‐treated T24 control (Scr) and KMT2C‐knockdown (KD1) cells. Results were obtained from 15 metaphases per group. White arrowheads indicate sister chromatid exchange events.
- DNA fiber assay on control (Scr) and KMT2C‐knockdown (KD1) T24 cells. BRCA1‐knockdown cells are used as controls. Experiments performed with or without hydroxyurea (HU) treatment under the conditions indicated in Fig 5D. The length of minimum 100 fibers from each condition was measured. Red horizontal lines indicate the median tract length in each group.
Source data are available online for this figure.
