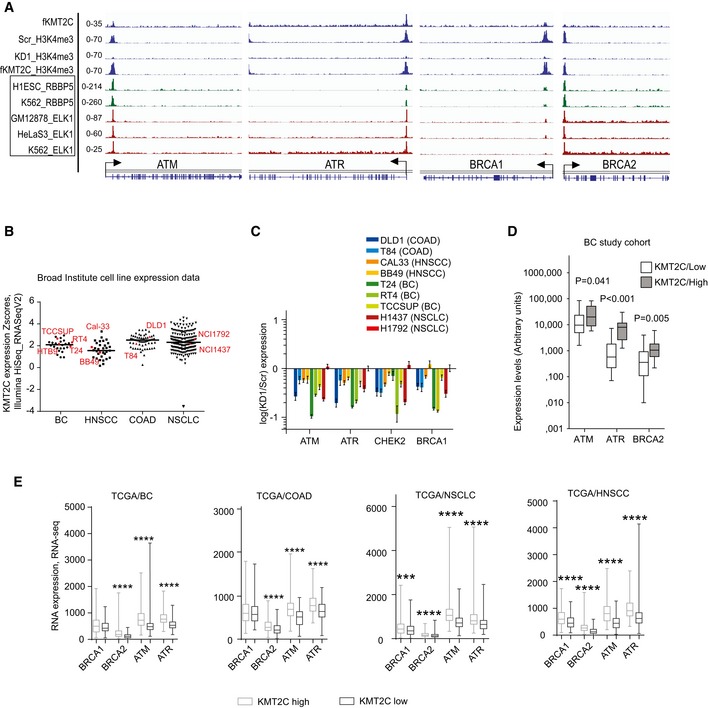
Figure 4. KMT2C controls the expression of DDR and DNA repair genes in various cancers.

- Bedgraphs indicating KMT2C and H3K4me3 binding at the TSS of indicated loci in HTB9 cells; also, from published studies available at the ENCODE, the binding of the COMPASS complex member RBBP5 and the transcription factor ELK1 is indicated in the same loci.
- KMT2C expression (y‐axis) in various human cell lines (x‐axis). Cell lines under study are indicated as red geometrical schemes. Data were obtained directly from the Broad Institute CCLE server.
- Expression levels of indicated genes in indicated cell lines upon KMT2C knockdown. Expression is shown as log(KD1/Scr) in the y‐axis. Remaining KMT2C transcript levels for all knockdown experiments can be found in Table EV2. Note that H1792 which shows poor KD1 (˜25%) also shows no change in ATM, ATR, BRCA1, and BRCA2 expression (light red bar appearing last in each set). Experiments were performed in triplicates. In plots, bars represent mean ± SEM.
- Correlation in expression levels between KMT2C and indicated genes in our study cohort of superficial and muscle‐invasive BC. Data obtained from qRT–PCR. Experiments were performed in duplicates. P values were calculated by Mann–Whitney U‐test.
- Correlation in expression levels between KMT2C and indicated genes in BC, COAD, NSCLC, and HNSCC tumors. RNA‐seq data were obtained from the TCGA through cbioportal.org. Mann–Whitney U‐test was used. *** designates P‐value < 0.001 and ****P‐value < 0.0001.
