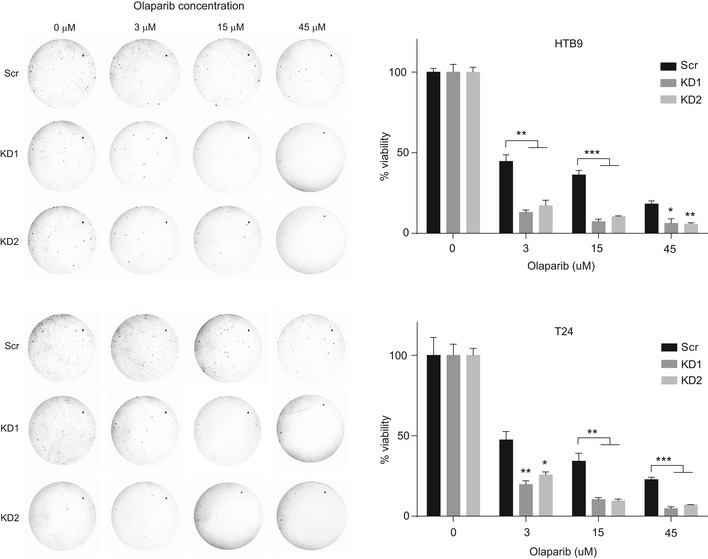
Figure EV5. In vitro clonogenic assays indicating PARPi sensitivity of KMT2C/KD cells.

Representative photographs (left) and number of colonies (y‐axis) generated by HTB9 and T24 (Scr and KMT2C/KD1) cells treated with increasing concentrations of olaparib (x‐axis). Cells were seeded and grown for 20 days at which point the experiment was concluded and dishes were photographed. Values in the plot indicate mean number of colonies ± SEM. Analysis of three experiments was performed using Student's t‐test. * designates P‐value < 0.05, ** designates P‐value < 0.01, and *** designates P‐value < 0.001.
