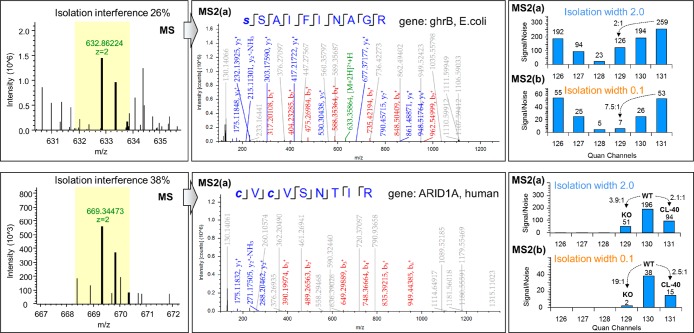
Figure 3.
Example spectra for E. coli and human peptides. Precursor ion cluster, annotated HCD MS2 fragment ion spectrum and TMT signal-to-noise values at “standard” and “narrow” isolation widths for a peptide matched to E. coli ghrB gene (top panel) and for a peptide matched to human ARID1A (bottom panel). Unassigned peaks are shown in gray font on the MS2 spectra.

