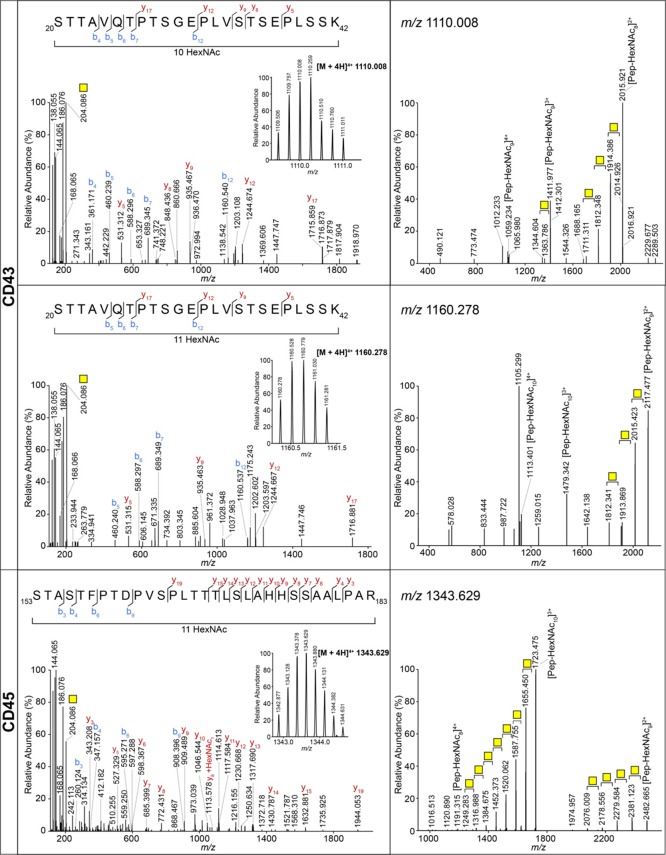
Figure 2.
Highly O-glycosylated peptides of CD43 and CD45. MS/MS spectra of glycopeptides from CD43 carrying 10 and 11 GalNAcs and CD45 carrying 11 GalNAcs. Left panels: HCD MS/MS spectra. b and y ions represent fragments without the GalNAc, unless indicated otherwise. The inset shows the MS spectrum of the corresponding precursor with charge state and m/z value. Right panels: CID MS/MS spectra. Yellow square: GalNAc.

