. 2019 Jan 11;10(7):1945–1952. doi: 10.1039/c8sc03781g

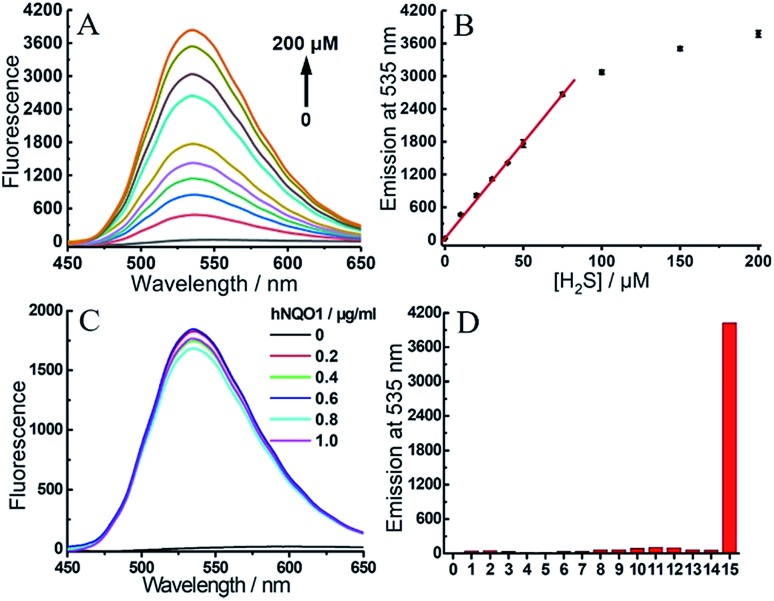
Fig. 5. (A) Emission spectra of 2 (1 μM) toward different concentrations of H2S (0–200 μM) in the presence of hNQO1 (1 μg mL–1). (B) Linear relationship (R2 = 0.999 up to 75 μM) between the emission at 535 nm from 2 and the concentration of H2S. (C) Emission spectra of 2 (1 μM) toward different levels of hNQO1 (0–1 μg mL–1) in the presence of H2S (50 μM). (D) Emissions at 535 nm of 2 (1 μM) after treatment with various biologically-relevant species. Lane 0, probe 2 alone; lanes 1–7, SO32– (200 μM), S2O32– (200 μM), Cys (500 μM), Hcy (500 μM), GSH (5 mM), H2O2 (200 μM), HClO (200 μM), respectively, all in the presence of H2S (200 μM); lanes 8–14, SO32– (200 μM), S2O32– (200 μM), Cys (500 μM), Hcy (500 μM), GSH (5 mM), H2O2 (200 μM), HClO (200 μM), respectively, all in the presence of hNQO1 (1 μg mL–1); lane 15, H2S (200 μM) and hNQO1 (1 μg mL–1).

Fig. 5