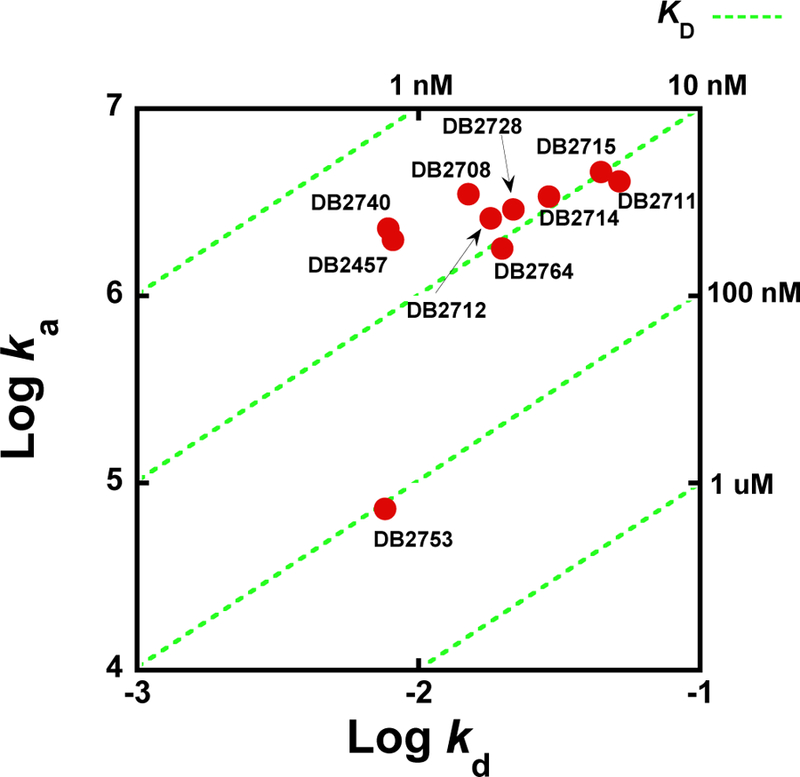
Figure 3.

Kinetic plot showing the relationship between on-rates (ka), off-rates (kd) and binding affinities (KD) (Green dash line) represented on the diagonal axis for compounds in Table 2, and determined by SPR. On-rates and off-rates and are plotted as logarithmic values.
