
Fig. 3. Post-transplant hepatic PPARα levels were down-regulated.
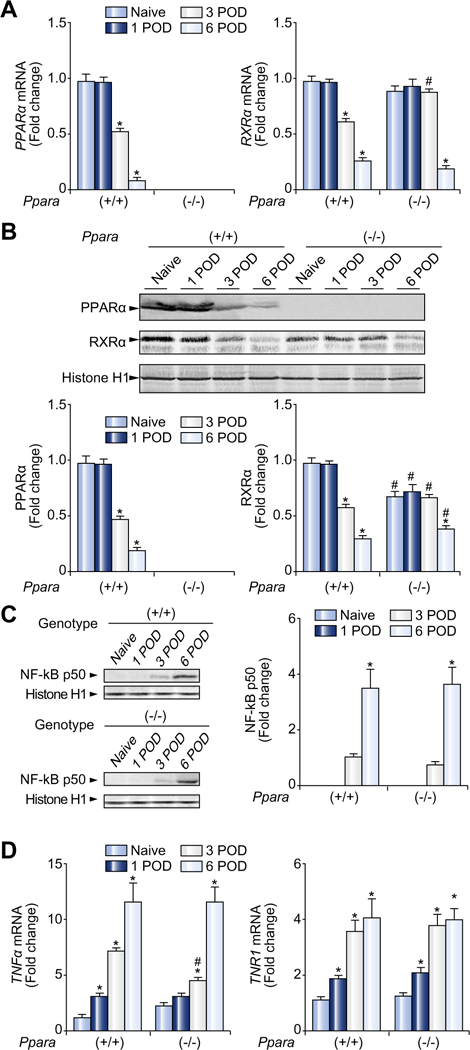
(A) Hepatic mRNA levels of PPARα and RXRα. The mRNA levels were normalized to those of GAPDH mRNA, and subsequently normalized to those of naïve Ppara+/+ mice. Results are expressed as mean ± SD (n = 4 in each group). POD, post-operative day; *p <0.05 vs. naïve mice of the same genotype; #p <0.05 vs. Ppara+/+ mice at the same time point. (B) Immunoblot analysis of PPARα and RXRα. Nuclear fractions (100 μg of protein) obtained from one mouse in each group were loaded. Histone H1 was used as the loading control. Band intensity was quantified densitometrically, normalized to that of histone H1, and subsequently normalized to that of naïve Ppara+/+ mice. Results are expressed as mean ± SD (n = 4 in each group). Abbreviations are the same as panel (A). (C) Immunoblot analysis of the NF-κB p50 subunit. The same samples used in panel (B) (nuclear fraction, 100 μg of protein) were loaded. Band intensity was quantified densitometrically, normalized to that of histone H1, and subsequently normalized to that of Ppara+/+ mice at 3 POD because the band was undetectable for naïve Ppara+/+ and Ppara−/− mice at 1 POD. Results are expressed as mean ± SD (n = 4 in each group). *p <0.05 vs. 3 POD of the same genotype; #p <0.05 vs. Ppara+/+ mice at the same time point. (D) Hepatic mRNA levels of TNFα and its receptor (TNR1). The same samples used in panel (A) were adopted. Results are expressed as mean ± SD (n = 4 in each group). Abbreviations are the same as panel (A).