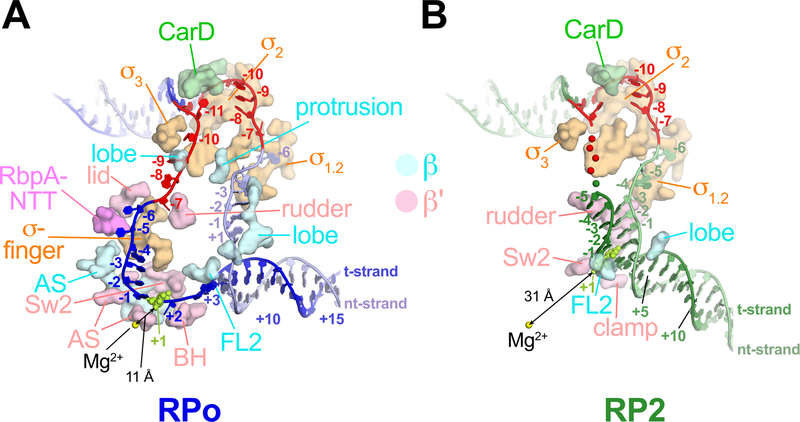
Figure 2 |. Protein/transcription bubble interactions.
DNAs are colored as in Fig. 1C. RNAP, CarD and RbpA residues that contact the DNA (< 4.5 Å) between −12 to +3 are shown as surfaces and labeled (FL2, fork loop 2; Sw2, switch 2; BH, bridge helix; AS, RNAP active site region). The double-arrowed black line denotes the shortest distance between the RNAP active site Mg2+ and an atom of the +1 t-strand DNA.
A. RPo.
B. RP2.

