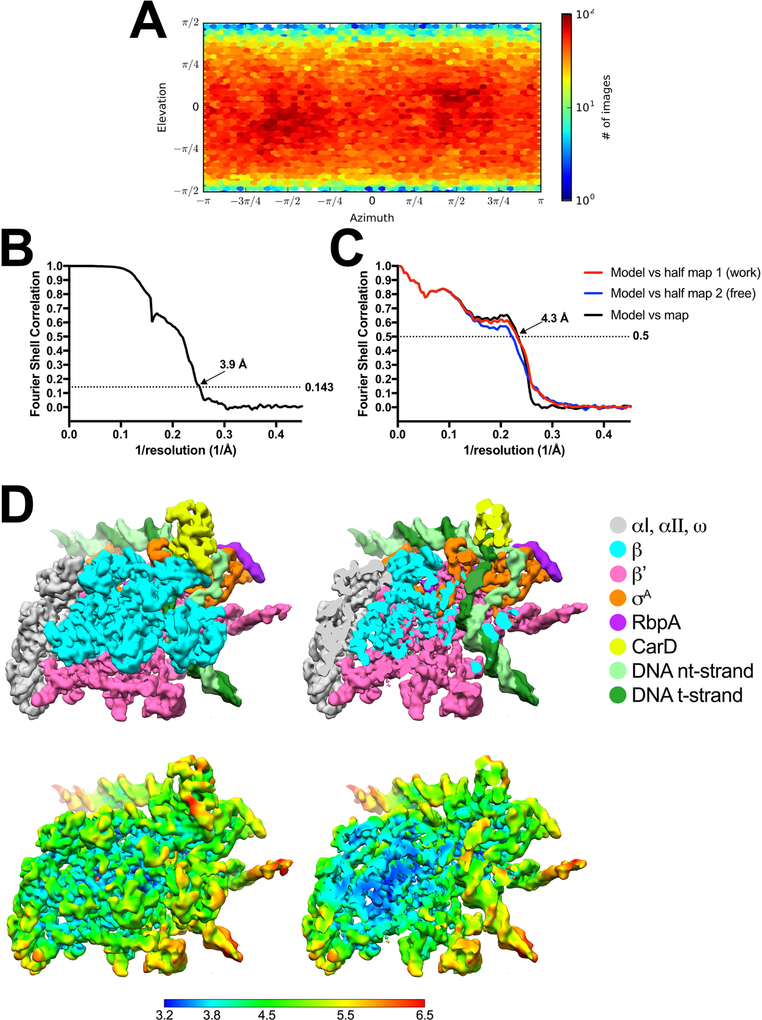
Extended Data Figure 5 |.
Cryo-EM of RP2 class.
(A) Angular distribution calculated in cryoSPARC for particle projections. Heat map shows number of particles for each viewing angle (less=blue, more=red).
(B) Gold-standard FSC41, calculated by comparing the two independently determined half-maps from cryoSPARC. The dotted line represents the 0.143 FSC cutoff which indicates a nominal resolution of 3.9 Å.
(C) FSC calculated between the refined structure and the half map used for refinement (work, red), the other half map (free, blue), and the full map (black).
(D) (top) The 3.9 Å-resolution cryo-EM density map of RP2 is colored according to the key on the right. The right view is a cross-section of the left view revealing the DNA inside the RNAP cleft.
(bottom) Same views as (top) but colored by local resolution36.

