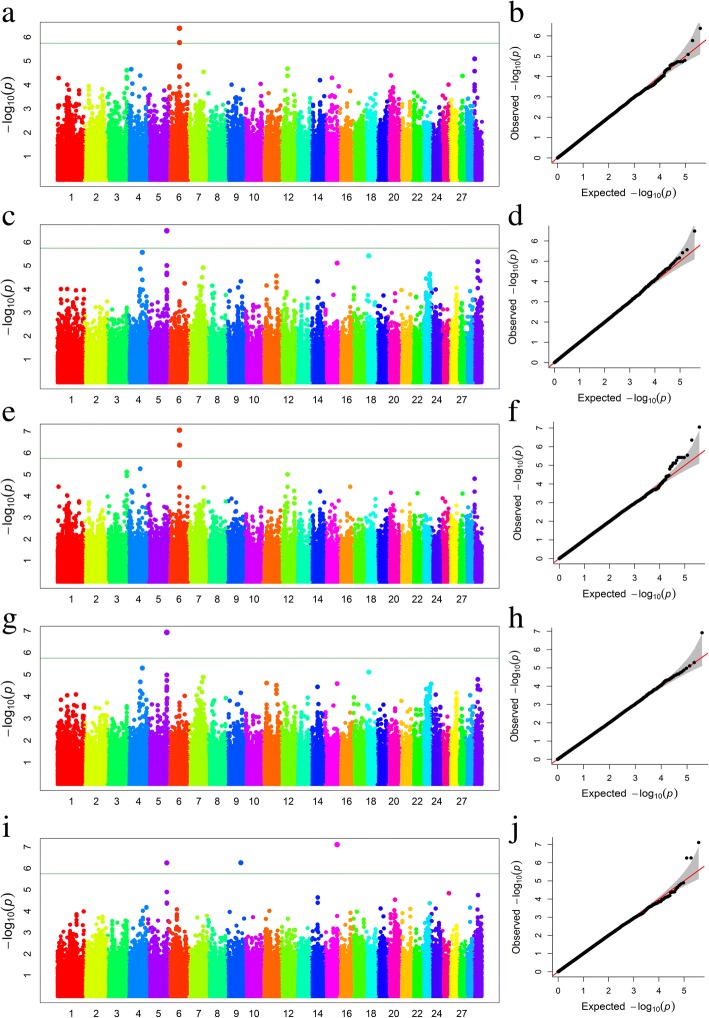
Fig. 3.
a Manhattan plot of association results for SFA, where the Y-axis was defined as -log10(P) and the genomic position was represented along the X-axis. The green line indicated P = 1.36E-06. b Quantile-quantile plot of 503,579 SNPs in the genome-wide association study for SFA. c Manhattan plot showing P-values of association for PUFA. d Quantile-quantile plot for PUFA. e Manhattan plot showing P-values of association for MUFA. f Quantile-quantile plot for MUFA. g Manhattan plot showing P-values of association for n-6. h Quantile-quantile plot for n-6. i Manhattan plot showing P-values of association for PUFA/SFA. j Quantile-quantile plot for PUFA/SFA

